English
 Français



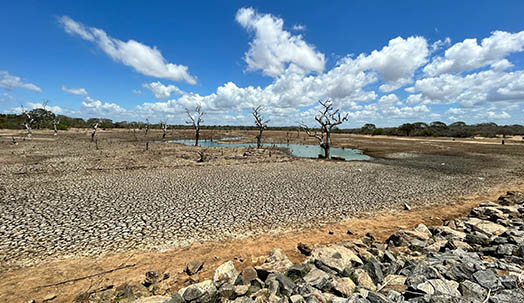
A century and a half ago, the earliest global temperature records showed a relatively stable trend. Since then, the trend has clearly reversed, with the last eleven years, without exception, ranking among the warmest on record since meteorological observations began in 1850. On a climate scale, such an acceleration is a cause for concern.
The graph below illustrates the trend in the average global temperature difference between land and oceans. To measure this imbalance, international climate organizations use a common reference point: the 1850–1900 period, known as the “pre-industrial” era, which corresponds to a time preceding the surge in emissions linked to human activities.
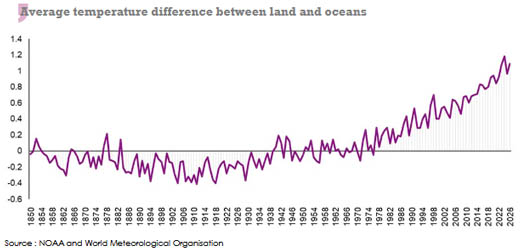
From 1850 to 1930, temperatures remained below the reference point. The shift began in the 1940s, gaining momentum significantly starting in 1980: each decade has been warmer than the previous one, without exception, rising from +0.23 °C to +0.99 °C over the 1985–2025 period. In four decades, the average global temperature has thus risen by nearly one degree.
According to the Global Water Monitor’s 2025 report (1), the number of days with extreme heat exceeding 35 °C is increasing by 8.3% per decade, posing a threat to human health, ecosystems, and agriculture.
In 2024, global greenhouse gas emissions reached a record high of 57.7 gigatons of CO2 equivalent, an 8% increase compared to the average for the 2010–2019 decade.
In 2025, a new record was set at 60.6 Gt CO2, a 5% increase from 2024, according to Climate TRACE (2). The rise in global greenhouse gas emissions is primarily driven by human activities.
(1) An annual scientific report on the state of the global water cycle in 2025. It is produced by the Global Water Monitor Consortium, which brings together universities and scientific organizations.
https://www.globalwaterstorage.info/en/global-water-monitor-2025-increase-in-hydrological-extremes
(2) An independent group that monitors, records and publishes greenhouse gas emissions.
Read also | Increase in extreme weather events
Global greenhouse gas emissions by sector in 2024
| Sector | Share of global emissions |
| Power / energy sector | 27% |
| Transport | 15% |
| Industry/energy | 11% |
| Agriculture | 11% |
| Fuel production | 10% |
| Industrial processes | 9% |
| Land-use change (including deforestation) | 8% |
| Buildings and other | 6% |
| Waste | 3% |
Source: UNEP’s Emissions Gap Report 2025
The burning of fossil fuels (electricity generation, transportation, industrial activities) is the main driver of global warming.
Agriculture and land-use change, combined, account for nearly one-fifth of global greenhouse gas emissions. This fact is particularly striking when one considers that these sectors are themselves among the most vulnerable to the consequences of the crisis they are helping to fuel, notably through agricultural droughts and wildfires exacerbated by deforestation.
Agricultural pollution and deforestation
Unlike energy and industrial activities, agriculture releases greenhouse gases primarily through biological processes. Methane (3) comes mainly from the digestion of ruminants, animal manure, and flooded rice cultivation.
Nitrous oxide (N2O)(4), on the other hand, is primarily linked to the use of nitrogen fertilizers on compacted soils. Its global warming potential is significantly higher than that of CO2. Agricultural machinery and greenhouse heating account for a smaller share of the sector’s emissions.
(3) Methane (CH4) is a greenhouse gas much more potent than CO2, but it remains in the atmosphere for a shorter period
(4) Nitrous oxide (N2O), primarily resulting from the use of nitrogen fertilizers in agriculture, is a potent greenhouse gas that contributes to global warming
Deforestation
Deforestation can also exacerbate extreme weather events locally.
According to a scientific study conducted over a 30-year period, the frequency of storms has doubled in West Africa in heavily deforested areas.
The loss of forest cover facilitates the movement of moisture-laden marine air, which intensifies heavy rainfall.
After a forest fire, burned soil can also become less permeable, promoting runoff and increasing the risk of flooding and flash floods in the months that follow.
Global deforestation and the main affected areas: 2000-2025
| Period | Main affected areas | Deforestation / forest loss | Main factors | Impact |
| 2000–2010 | South America, Africa, Asia tropical | ≈ 11 Mha/year | Agriculture, livestock farming, land conversion | Heavy pressure on tropical forests and their carbon storage capacity |
| 2010–2018 | South America and Africa | ≈ 7.8 Mha/year | Mainly agricultural expansion | Soil and water resource degradation |
| 2018–2020 | Africa, South America and Asia | ≈ 10.2 Mha/year | Agriculture, livestock farming, and other land-use changes | Forest loss remains significant despite a slight slowdown |
| 2019 | Sub-Saharan Africa, Australia, the Amazon and boreal regions | ≈ 123 Mha of forest affected by fires | Wildfires and human-made fires | Ecosystem degradation, loss of biodiversity and significant carbon emissions. |
| 2020–2025 | Sub-Saharan Africa, South America, Southeast Asia | 41 Mha of net forest loss | Agricultural conversion, livestock farming, forestry, infrastructure, and fires | Continued loss of biodiversity and carbon storage capacity |
Mha = million hectares.
Sources: FAO, Global Forest Resources Assessment 2020 and Global Forest Resources Assessment 2025; FAO Remote Sensing Survey.