

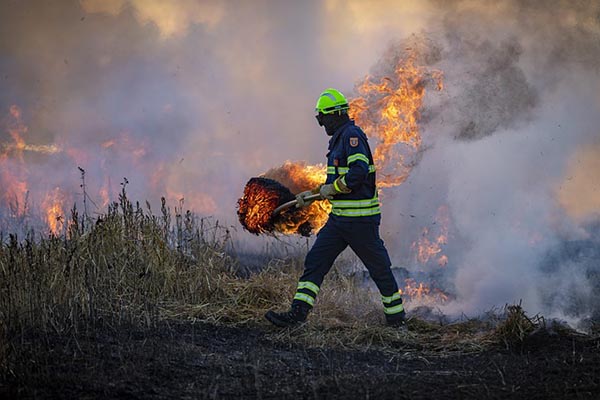
Forest and bush fires cause significant economic losses, amplified by the increasing frequency, extent and severity of the fires.
In addition, the concentration of real estate and the high value of property built and accumulated in wildfire-prone areas mean that financial losses are increasingly high.
Although the United States (mainly California) accounts for most economic losses, fires in Canada, Australia and Europe also contribute significantly to these losses.
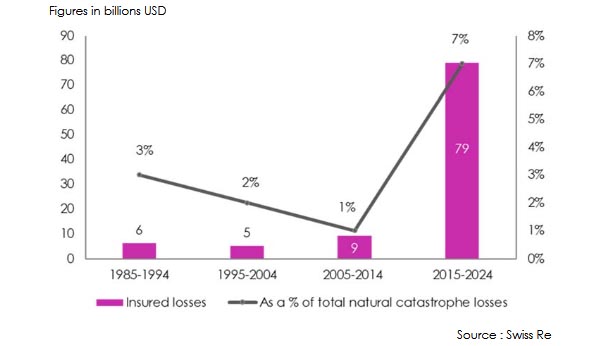
Between 2015 and 2024, wildfires cost the global economy 132.6 billion USD, setting insurers and reinsurers back 78.6 billion USD. According to Swiss Re, it was from 2016 onwards that the burden of this type of catastrophe increased considerably.
During the 2005-2014-decade, insured losses due to forest fires totalled just 9 billion USD for the insurance industry, compared with 78.6 billion USD in the following decade (2015-2024).
Read also | Wildfires: a threat to insurers
Wildfires: insured losses
Over the last decade, that is from 2015 to 2024, worldwide insured losses from forest fires far exceeded those recorded in previous decades.
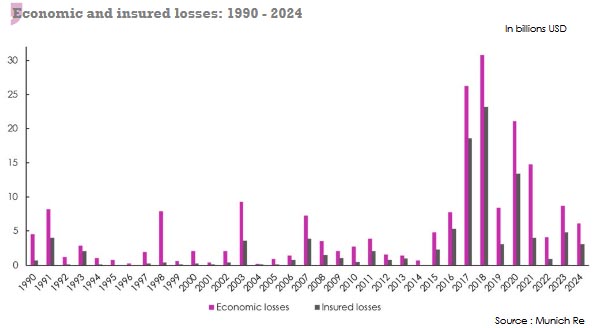
Wildfires: 2018, a record-breaking year
In terms of areas destroyed, countries affected by wildfires and economic losses, 2018 set the top record.
Between July and November this year, California alone suffered a series of devastating fires: Camp Fire, Woolsey Fire, Carr Fire, Ferguson, Mendocino Complex.
All in all, 2018 ended with a heavy toll of 7 948 fires in the four corners of the globe, 100 fatalities, economic losses worth 30.8 billion USD and insured losses of 23.2 billion USD.
In economic and insurance terms, this 2018 record toll could be far surpassed by the last wildfire that ravaged Los Angeles County in January 2025.
Wildfires: economic and insured losses 2015-2024
According to Munich Re, 2024 has been fairly mild in terms of both economic and insured losses. Fires set back the global economy 6.1 billion USD in 2024, compared with 8.7 billion USD a year earlier.
Insured losses stood at 3 billion USD in 2024, compared with 4.8 billion USD in 2023.
| Year | Losses in billions USD | Area burnt in hectares | |
| Economic | Insured | ||
| 2024 | 6.1 | 3 | 388 187 000 |
| 2023 | 8.7 | 4.8 | 399 923 000 |
| 2022 | 4.1 | 0.9 | 364 051 000 |
| 2021 | 14.8 | 4 | 384 226 000 |
| 2020 | 21.1 | 13.4 | 408 747 000 |
| 2019 | 8.4 | 3.1 | 407 480 000 |
| 2018 | 30.8 | 23.2 | 329 695 000 |
| 2017 | 26.2 | 18.6 | 411 780 000 |
| 2016 | 7.8 | 5.3 | 416 143 000 |
| 2015 | 4.8 | 2.3 | 443 512 000 |
Sources: Munich Re and ourworldindata.org
Read also | Major wildfires: 2015-2024