The Rwandan insurance market

Insurance market features
- Regulatory authority: Association of the Rwandan insurance companies
- Premiums (2004): 14 022 661 USD
- Insurance density (2004): 1.55 USD
- Penetration rate (2004): 0.77%
Market structure in 2004
- Insurance companies: 4
- Intermediaries: 625
Identity
- Area: 26 338 Km2
- Population (2005): 9 000 000 inhabitants
- GDP (2005): 1.817 billion USD
- GDP per capita (2005): 202 USD
- GDP growth rate (2005): 4%
- Inflation rate (2005): 12.1%
- Main economic sectors: cacao, coffee, gold, agriculture
Major cities
(in number of inhabitants)
- Kigali (capital): 745 261
- Butare: 89 600
- Gitarama: 87 613
- Ruhengeri: 86 685
Main economics indicators: 2000-2004
in USD| 2000 | 2001 | 2002 | 2003 | 2004 | |
|---|---|---|---|---|---|
GDP | 1 552 155 172 | 1 687 027 020 | 1 614 400 000 | 1 628 544 061 | 1 817 000 000 |
GDP per capita | 204 | 210 | 197 | 196 | 202 |
Insurance density | 0,86 | 0.87 | 1.30 | 0.86 | 1.55 |
Penetration rate | 0.42% | 0.41% | 0.66% | 0.44% | 0.77% |
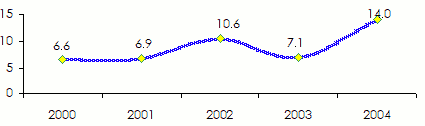
Turnover evolution: 2000-2004
in millions USD| Gross premiums | 2000 | 2001 | 2002 | 2003 | 2004 | 2003/2004 growth rate |
|---|---|---|---|---|---|---|
Non life | 6.2 | 5.7 | 7.7 | 4.5 | 9.2 | +96.3% |
Life | 0.4 | 1.2 | 2.9 | 2.6 | 4.8 | |
Total | 6.6 | 6.9 | 10.6 | 7.1 | 14 |
Premiums split by class of business*: 2003-2004
in millions USD| Class | 2003 | % | 2004 | % |
|---|---|---|---|---|
| Non life | ||||
Motor | 2.7 | 38 | 5.1 | 36.4 |
Fire | 0.6 | 8.5 | 0.9 | 6.4 |
Accidents & health | 0.2 | 2.8 | 1.9 | 13.6 |
Miscellaneous | 0.4 | 5.6 | 0.5 | 3.6 |
Marine | 0.6 | 8.5 | 0.8 | 5.7 |
Non life total | 4.5 | 63.4 | 9.2 | 65.7 |
| Life | ||||
Life | 2.6 | 36.6 | 4.8 | 34.3 |
Grand Total | 7.1 | 100% | 14 | 100% |
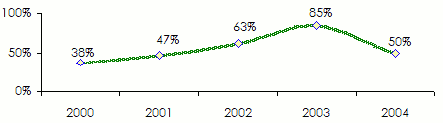
Non-life & life loss ratios: 2000-2004
| 2000 | 2001 | 2002 | 2003 | 2004 | |
|---|---|---|---|---|---|
Non life loss ratio | 35% | 47% | 67% | 86% | 38% |
Life loss ratio | 76% | 45% | 55% | 83% | 71% |
Non-life & life loss ratio | 38% | 47% | 63% | 85% | 50% |
Exchange rate USD/XOF as at 31/12 | 2000 | 2001 | 2002 | 2003 | 2004 |
696 | 740 | 625 | 522 | 481 |
Source: FANAF - The African Insurance Market: Data 2000-2004