Mapping of major risks 2024
Atlas Magazine maps out the major risks that the business will have to address in the years ahead.
Mapping of major risks: customer experience challenges
 Customer experience encompasses all the interactions a customer may have with an insurance company, whether before, during or after underwriting a policy. It also comprises contacts, whether physical, digital or human ones.
Increasingly demanding, customers expect a fluid and personalized relationship through:
- customized services: tailored to the policyholder's needs and professional and social situation,
- online underwriting and the proposal of practical, reliable solutions,
- secure data and sensitive information,
- simplification of online claims notification and file follow-up,
- multi-channel communication, agency, telephone, mobile apps, social media and websites.
To guarantee an optimal customer experience, insurers are increasingly investing in new technologies as new players have also emerged, such as “insurtechs” and "big-techs", offering innovative solutions for the insurance market.
Mapping of major risks: integrating generative AI
 It is clear that artificial intelligence (AI), capable of generating new texts, images and videos from prompts, is revolutionizing the insurance industry. For insurance companies, AI is helping to cut costs, transform customer communications, improve claims processing, detect fraud and automate underwriting and pricing processes
Worldwide, the insurance industry's investment in generative AI reached 300 million USD in 2022, a figure poised to rise to 5.5 billion USD by 2032, with an average annual growth rate of around 33%.
Still on a global scale, total IT spending by the insurance sector rose by 7.9% in 2023 to 208.4 billion USD, compared with 193 billion USD in 2022.
According to consulting firm Capgemini, this spending should continue to grow by an average of 8.1% per year until 2027.
Integrating AI, however, requires a number of prior measures such as:
- the implementation of an AI integration strategy with a practical roadmap,
- the establishment of strategic partnerships with technology leaders,
- training and skills enhancement within a competitive and constantly changing work environment,
- attracting new technological talent.
However, AI can showcase certain risks for the profession, including:
- data security: sensitive customer information may be subject to cyber-attacks,
- algorithmic bias: AI models may present anomalies in the data collected, which could result in certain scenarios or categories of individuals not being considered when the algorithm is run. This is known as technological discrimination,
- complexity and opacity: some AI models can be complex and difficult to understand and use,
- technological dependency: heavy investment in AI can generate a dependency on technology, which can pose problems in the event of system failure,
- cultural resistance: employees and customers may be reluctant to adopt AI due to fears of replacing traditional jobs, or uncertainty about the reliability of automated systems,
- high implementation costs: setting up AI systems can be costly in terms of development, staff training and infrastructure requirements,
- rapid technological evolution: AI is evolving rapidly. As a result, companies need to invest in constant technology watch and upgrades to stay competitive.
(1) Prompt: Short text that directs an artificial intelligence to create an image, video, text, or computer code.
Mapping of major risks: cyber risks
Faced with the escalating costs of cyberattacks, many insurance companies have excluded this risk from their liability policies, reconsidering their approach to risk. France's AXA Group, for example, has been applying this exclusion since 1 January 2023, while Italy's Generali has stopped covering ransomware paid by businesses since the end of 2021.
For its part, US insurer AIG is terminating 30% of its cyber policies in 2021, and excluding this risk from its liability coverage. More recently, Lloyd's of London announced that state-sponsored attacks were eliminated from its coverage since 1 March 2023.
As a result of this market downturn, many companies are finding it difficult to find insurance solutions tailored to their needs and budgets.
Mapping of major risks: natural disasters and extreme weather events
 Global warming, notably observed for many years, is constantly increasing the intensity and frequency of natural disasters, with a new world heat record being set in 2023. The past year also witnessed a high number of floods, heatwaves, snowstorms, hurricanes, droughts and other meteorological phenomena, resulting in heavy economic and insurance losses.
According to figures published by broker Aon, economic losses due to natural disasters amounted to 380 billion USD in 2023 while insured losses were set at 118 billion USD, exceeding the ten-year average of 90 billion USD and the 30-year average of 57 billion USD.
The deadly earthquake of 6 February 2023 in Turkey and Syria was the costliest event of the past year, with economic losses estimated at 92.4 million USD.
According to a recent Swiss Re study, climate change is set to have a growing impact on economies, with a likely decline of 7 to 10% in global gross domestic product (GDP) by 2050.
Top 10 countries most exposed to weather risks in 2023
| Ranking | Country | Annual economic loss as a % of GDP |
|---|---|---|
| 1 | Philippines | 3% |
| 2 | United States | 0.38% |
| 3 | Thailand | 0.36% |
| 4 | Austria | 0.25% |
| 5 | China | 0.22% |
| 6 | Taiwan | 0.21% |
| 7 | India | 0.20% |
| 8 | Australia | 0.19% |
| 9 | Switzerland | 0.19% |
| 10 | Japan | 0.18% |
Source: Swiss Re
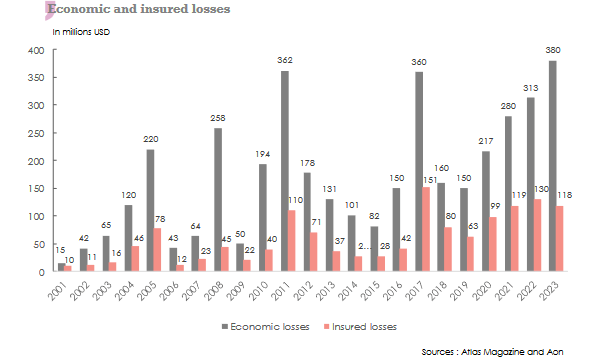
Natural disasters: 2001-2023
The trend of natural disasters between 2001 and 2023 reveals significant variations between economic and insured losses. Economic losses reached a peak of 380 billion USD in 2023, compared with 15 billion USD in 2001.
Insured losses also vary significantly from year to year, with a low of 10 billion USD in 2001 and a high of 151 billion USD in 2017. 2023 ends with 118 billion USD of insured losses.
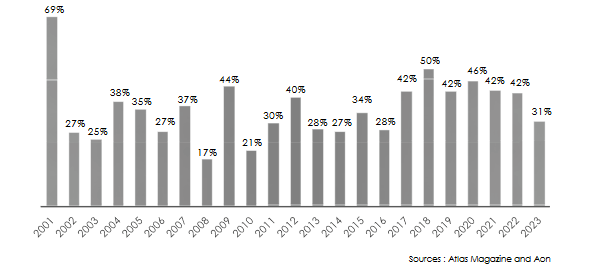
Coverage rate of insured losses
The coverage rate of insured losses depends on the location where natural disasters occur. Major events in highly developed countries such as the USA, Japan and Europe have higher coverage rates than those in Africa or Latin America.
In 2001, for example, the coverage rate reached a 22-year high of 69%, a year marked by storm Allison, which hit the United States, causing 5 billion USD in economic losses out of an annual total of 15 billion USD. In fact, out of this 5 billion USD, 4.89 billion USD was insured.
Similarly, in 2017 and 2018, coverage rates reached 42% and 50% respectively, two years impacted by major hurricanes in the United States (Harvey, Irma and Maria) and major fires in California. All these events resulted in high insured losses.
Conversely, insured losses in 2023 accounted for just 31% of total claims costs. This relatively low percentage is explained by the occurrence of events with low natural catastrophe coverage in Turkey, the Philippines, Vietnam, Libya and Mexico.
Read also | List of major natural disasters in 2023
The insurance market up against natural disasters
Faced with the growing burden of natural catastrophe claims, some US insurers (State Farm and AllState) have opted out of this class of business altogether, in California and Florida. Others, such as AIG and Farmers Group, have opted to drastically reduce their exposure to this type of risk.
These decisions underline the need for insurers to constantly reassess their approach to natural catastrophe risks, and to adapt proactively to market conditions. In the same vein, rates for natural catastrophe programs rose by an average of 3% on 1 January 2024, following a 37% increase a year earlier. The percentage increase in 2024 varies considerably according to the regions affected by natural events. In Italy, Slovenia and Turkey, for example, the increase exceeded 10%.
Diversifying portfolios, strengthening equity capital and redeploying available capacity are all solutions used by reinsurers to offset the negative impact of natural catastrophe risks.
Mergers and acquisitions also appear to be a way of dealing with this type of risk.
Mapping of major risks: macroeconomic trends
Macroeconomic developments encompass all changes and trends affecting the economic sphere. Performance indicators such as Gross Domestic Product (GDP), inflation, interest rates, budgetary and monetary policies are particularly highlighted by this approach.
The impact of GDP and inflation on the market is particularly significant.
Decline in GDP
An obvious correlation exists between trends in GDP and the insurance sector, with a fall in GDP resulting in a drop in the amount of premiums written. In a context of reduced disposable income measured by GDP, the ability of individuals and companies to pay their insurance premiums becomes difficult, especially when the general economic climate deteriorates (unemployment, redundancies, inflation, etc.).
Conversely, a sharp rise in GDP can translate into strong growth in premiums.
Read also | Evolution of GDP and insurance premiums
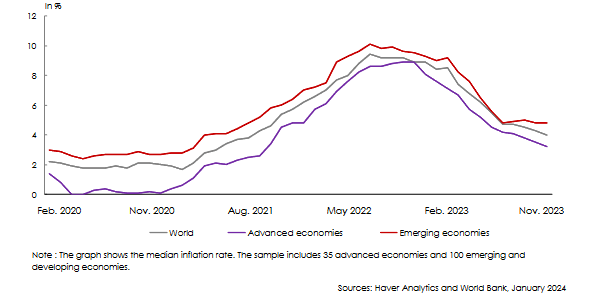
Mapping of major risks: inflation and currency depreciation
Although inflation has continued to fall worldwide since March 2023, it remains above the targets set by many countries. Forecasts for 2024 point to inflation rates higher than those recorded before the pandemic. In countries sustaining financial woes, inflation remains high and often associated with currency depreciation.
For instance, the Egyptian pound lost 49% of its value between February 2022 and March 2023, as the country ran into alarming inflation, averaging 37.4% at the end of August 2023.
In the same context, inflation in Turkey reached 61.36% in October 2023, while from 2018 to 2023, the Turkish lira lost 78% of its value against the dollar.
In another example, the Lebanese pound had lost over 95% of its value against the dollar between 2020 and 2023 due to the economic and political crisis shaking the country.
Inflation strains insurance companies' earnings, leading to higher management costs and higher claims expenses. To maintain a balance between resources and expenses, insurers are obliged to increase their rates, a very challenging move in competitive markets.
Mapping of major risks: political risk
The year 2023 was marked by the emergence of new political conflicts and social movements. Alongside the wars in the Middle East and Ukraine, armed conflicts also broke out in Somalia, Sudan, Yemen, Burma and several other parts of the world.
These growing geopolitical tensions, which are disrupting supply chains, are impacting raw materials markets, financial centers and international trade, causing not only loss of life, but also significant material damage to infrastructure and property.
Repeated and sometimes long-lasting conflicts lead to production stoppages, price hikes, shortages and higher insurance premiums, particularly for transport and property damage risks.
As a result, many insurers and reinsurers have reduced their capacity for this type of risk. Even Lloyd's syndicates, as well as the Bermuda market and some US insurers specializing in this type of risk, have revised their coverage and capacity downwards.
Read also | Political risks, what a coverage?
Mapping of major risks: major current conflicts
- Russia-Ukraine war
The escalation of the Russian-Ukrainian conflict, which is directly affecting global energy and grain supplies, is taking its toll on the marine, export credit, property damage and aviation classes of business.
Since the start of the conflict, the waters of the Black Sea and the Sea of Azov have been considered high-risk zones, with ships being exposed to destruction and cargo theft. As a result, war-risk marine transport rates have risen sharply.
In the aviation sector, the Russia-Ukraine war has led to the immobilization and confiscation by Russia of almost 400 aircraft belonging to Western aircraft leasing companies. This has resulted in a large number of insurance claims, with the total losses being estimated by the market at 8 billion USD. A partial agreement was recently reached between the Russian authorities and the aircraft leasing companies concerning the sale of around 100 aircraft worth 2.5 billion USD.
- Israel-Hamas war
The Israel-Hamas war is the second major conflict whose consequences are disrupting the insurance market. Due to the destruction and loss of life, the instability of the situation and the risks of the conflict spreading to other countries in the region, many insurers and reinsurers have reduced their exposures in the area.
The market's response to the conflict has been wide-ranging, with some players simply decreeing a halt to underwriting, and others increasing rates by a factor of ten. The market has also reacted by reducing coverage, terminating certain risks and reducing capacity.
- Marine risks in the Red Sea
War-risk rates for ships using this extremely busy shipping lane have risen considerably since the end of 2023. This trade route linking Europe, the Middle East and Asia, is sustaining major disruptions (armed attacks, ship takeovers) resulting in higher hull and marine cargo rates. Marine insurance premiums (hull and cargo), which in the recent past averaged 0.05%, can now be as high as 1%.
Ships transiting the Red Sea are generally mega structures. For example, the hull and machinery value of a giant oil tanker can exceed 125 million USD, while the value of goods carried by a mega-container ship can reach up to one billion USD.
Ships using this high-risk shipping lane are now required to inform their insurers as soon as they arrive in the area. The terms of the contract are then adjusted and an additional "war risk" premium is charged by the insurer.
The precarious situation in the Red Sea has also had a detrimental effect on shipping routes. Changes in shipping routes have repercussions on energy supplies, driving up the price of raw materials.
According to a report by LSEG Shipping Research, the cost of a shipment between Asia and Europe has risen by 35% for a mega-container ship, and by up to 110% for an oil tanker with a capacity of between 80 000 and 120 000 tons.
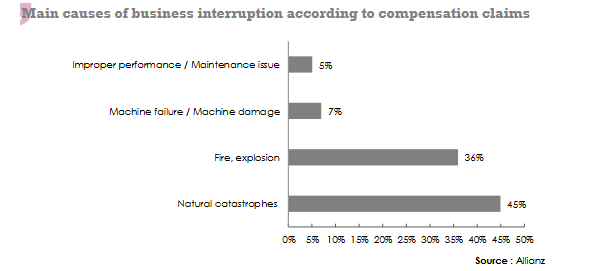
Mapping of major risks: business interruption and supply chain disruption
Business interruption risk is defined as the fortuitous or accidental event that causes a partial or total cessation of activity for a company or all the players in a market. Often covered by insurance companies, this risk leads to a disruption in the supply chain.
Classified in a single category by Allianz in its 2024 Risk Barometer, business interruption and supply chain disruption represent the risk most dreaded by companies in many countries.
The risk is manifest following the occurrence of events such as those listed below.
- material damage following a fire, flood, explosion, equipment failure, ...
- natural disasters: storm, cyclone, hail, earthquake, ...
- cyberattacks: hacking, ransomware,...
- human-made events: negligence, sabotage, ...
- supply shortages: stock-outs, defaulting supplier, ...
- pandemics: staff absenteeism, logistical challenges, ...
- political and social events leading to business interruption,
- disruption of goods transport by sea, air, river or land,
- major financial events: financial crisis, stock market crash, recession, economic fluctuations.
Recent examples of business interruption and supply chain disruption:
- Canada, summer of 2023: shutdown of oil and gas processing plants following severe forest fires, with the interruption of production of 240 000 barrels of oil per day.
- Red Sea, mid-December 2023 to early January 2024: political instability in the waters of the Red Sea prompted over 400 container ships to change their itinerary, thus avoiding crossing the Suez Canal. The change of route via the Cape of Good Hope lengthens voyages by 10 to 20 days, causing major delivery delays.