

An analysis of economic and insured losses caused by natural disasters over the 24-year period 2000-2023 has revealed three major phenomena with devastating consequences.
Tropical cyclones are the greatest risk. Localized in specific areas, they have caused 2 096 billion USD in economic losses over 24 years.
Floods come second, with 1 766 billion USD in cumulative economic losses over the period mentioned.
Finally, earthquakes come third in the ranking of the most devastating risks, with 1 149 billion USD of economic losses.

While earthquakes are due to tectonic movements, the occurrence of other phenomena such as tropical cyclones, floods, storms, droughts, heatwaves and forest fires is becoming increasingly linked to global warming, which exacerbates their frequency, intensity and consequences.
Risk mapping: tropical cyclones
Tropical cyclones are violent low-pressure systems that develop over tropical oceans. High sea surface temperatures, an unstable atmosphere, high humidity, low wind shear and other factors can give rise to tropical cyclones.
Global warming, which increases both ocean temperatures and atmospheric humidity, favors the formation of increasingly intense and long-lasting cyclones.
Cyclones are characterized by sustained winds exceeding 118 km/h, heavy rainfall and rising sea levels. Their impact on coastal areas can be devastating, resulting in considerable loss of life and property.
These atmospheric phenomena are known under many different names. Depending on their location, they are named hurricanes in the Atlantic, typhoons in the Pacific and cyclones in the Indian Ocean.
Risk mapping: cyclone regions
Tropical cyclones affect several specific geographical areas.
| Ocean basin | Countries | Number of cyclones in 2023 |
| Western North Pacific | China, Taiwan, Japan, Philippines | 35 |
| Eastern North Pacific | Western Mexico, Hawaii, California | 35 |
| Western South Pacific | Australia, Oceania, New Guinea | 20 |
| Northern Indian Ocean | India, Bangladesh, Sri Lanka, Burma, Pakistan | 15 |
| Southwest Indian Ocean | Madagascar, Mozambique, Reunion Island, Mauritius, Tanzania, Kenya | 12 |
| North Atlantic | United States, Mexico, Central America, Caribbean, Canada | 30 |
Sources: Wikipedia and Aon-Climate and Catastrophe Insight
Asia-Pacific, the United States, the Gulf of Mexico and the Caribbean islands are the areas hardest hit by cyclones over the last ten years.
In 2023, tropical cyclones worldwide caused an estimated 35 billion USD in economic losses, with only 6 billion of these losses are insured.
America (excluding the United States) is the most affected zone, with 16 billion USD of damage, followed by Asia-Pacific with 14 billion USD.
The costliest tropical cyclones: 2014-2023
Figures in billions USD
| Date | Event | Countries | Economic losses | Insured losses |
| August 2017 | Hurricane Harvey | United States | 125 | 30 |
| September 2022 | Hurricane Ian | United States, Cuba | 96 | 54 |
| September 2017 | Hurricane Maria | United States, Caribbean | 90 | 30 |
| September 2017 | Hurricane Irma | United States, Caribbean | 77 | 33 |
| August-September 2021 | Hurricane Ida | United States, Caribbean | 75 | 36 |
| October 2023 | Hurricane Otis | Mexico | 15.3 | 2.1 |
| August 2023 | Hurricane Idalia | United States, Cuba, Bermuda Canada | 3.5 | 1.5 |
Source: Aon-Climate and Catastrophe Insight
The 2024 most expensive tropical cyclones
Tropical cyclones are likely to cause more than 100 billion USD (1) in economic damage in 2024, almost triple the losses recorded in 2023. These extreme events would account for 30% of total global losses, mobilizing the insurance market to the tune of 57 billion USD (1).
(1) Atlas estimates
Read also | The most expensive tropical cyclones in 2024
Risk mapping: flooding
Increasingly frequent and intense, floods are causing substantial and human damage. Global warming has resulted in higher temperatures and accelerated snowmelt, increasing river flows and rising oceans.
Coastal areas are particularly at risk of flooding, especially during storms and high tides.
Meanwhile, urbanization is reducing the soil's capacity to absorb water. This, combined with poor storm water management and often inadequate drainage infrastructure, increases the risk of flooding. The consequences are disastrous for infrastructure, agriculture and people alike.
Risk mapping: Flood-prone regions in 2023
| Region | Country/State | Number of floods in 2023 |
| United States | California, Nevada, Florida, Midwest, Northeast, New York, New Jersey, Connecticut | 14 |
| America (excluding USA) | Chile, Argentina, Brazil, Ecuador, Caribbean, Canada | 28 |
| Europe | Italy, Spain, Austria, Netherlands, Germany, France, Poland, Romania, Slovakia, Czech Republic, Turkey | 16 |
| Middle-East | Iran, Iraq, Saudi Arabia | 18 |
| Africa | South Africa, Angola, Morocco, Libya, Kenya | 15 |
| Asia-Pacific | Indonesia, China, Vietnam, India, Japan | 38 |
| Oceania | New Zealand, Pacific Islands | 2 |
Source: Aon - Climate and Catastrophe Insight
Most expensive floods: 2014-2023
China, Western Europe and Italy have sustained the most severe flooding in the last ten years.
Figures in billions USD
| Date | Event | Countries | Economic losses | Insured losses |
| July 2021 | Floods in Europe | Germany, Austria, Belgium, France, Italy, Romania, United Kingdom, Switzerland, Turkey, Croatia, Luxembourg, Netherlands | 46 | 12 |
| June-September 2020 | Seasonal flooding | China | 35 | 2.8 |
| May-August 2016 | Yangtze River floods | China | 28 | 0.4 |
| June-September 2021 | Seasonal flooding | China | 31 | 2.1 |
| May 2023 | Emilia-Romagna floods | Italy | 9.8 | 0.6 |
| June-September 2023 | Seasonal flooding | China | 32.15 | 1.4 |
The 2023 floods
Worldwide, the 2023 floods caused economic losses estimated at 85.2 billion USD.
China was particularly hard hit, with seasonal flooding accounting for 78.5% of the 41 billion USD in losses recorded in the Asia-Pacific region.
The American continent accounted for 19.2 billion USD of damage, including 12 billion USD in the United States. Europe (Italy), the Middle East (United Arab Emirates) and Africa (South Africa) suffered significant damage in 2023, estimated at 25 billion USD.
The 2024 floods
The floods of 2024 had devastating consequences, both in human and economic terms. With 7 604 victims in the first nine months of the year, these events resulted in financial losses estimated at 87 billion USD, 2 billion USD more than in the whole of 2023.
Floods, which account for a third of all natural catastrophe losses, set insurers back 15 billion USD, including 13 billion USD for events in Europe and the United Arab Emirates alone.
Read also | The costliest floods of 2024
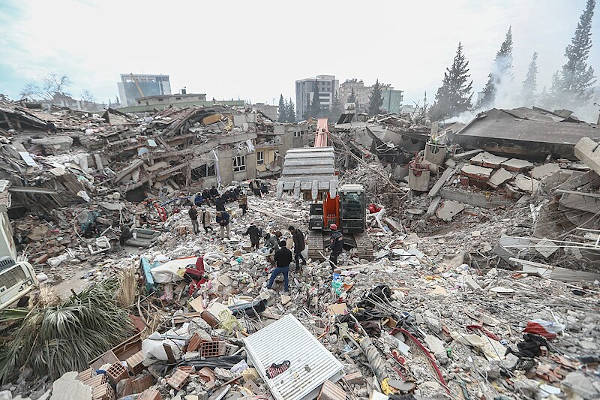
Risk mapping: earthquakes
Earthquakes are triggered by the movement of tectonic plates, releasing the energy accumulated on faults.
Some recent studies link increased seismic activity to climate change.
According to this theory, the accelerated melting of the ice caps, a direct consequence of global warming, could be at the origin of this increase. By losing mass, glaciers reduce the pressure exerted on the earth's crust, which can cause tectonic plates to readjust, leading to earthquakes, tsunamis and even volcanic eruptions.
Regions most affected by earthquakes
| Country | Number of major earthquakes 1990-2024 |
| China | 186 |
| Indonesia | 166 |
| Iran | 109 |
| Japan | 98 |
| United States | 78 |
| Turkey | 62 |
| India | 58 |
| Philippines | 55 |
China, Indonesia and Iran are the countries most frequently affected by this scourge. Six of the eight countries hardest hit by earthquakes are in Asia.
Located at the convergence of several tectonic plates, Japan is a hotbed of global seismic activity. According to data from the US National Oceanic and Atmospheric Administration (NOAA), the country ranks fourth in the list of countries hardest hit by major earthquakes, with a total of 98 events recorded over the past 34 years.
In the Americas, the West Indies, California and the Andes are the regions most prone to strong seismic activity.
The 2023 earthquakes
In 2023, earthquakes dominated the natural disaster risk landscape, taking a heavy human toll of over 64 000 deaths.
In economic terms, these events generated global losses estimated at 99 billion USD. Earthquakes in Turkey and Syria accounted for 93.4% of these losses, or 92.4 billion USD.
The Marrakech region of Morocco was shaken by a violent earthquake on 8 September, 2023, which caused almost 3 000 deaths, 6 000 injuries and 4 billion USD in material damage.
The 2024 earthquakes
On 1 January 2024, central Japan was severely shaken by a magnitude 7.6 earthquake, the costliest earthquake of the year, with losses estimated at 12 billion USD, only 3 billion USD of which were borne by the insurance market.
The costliest earthquakes in 2024
Figures in millions USD
| Date | Countries | Economic losses |
| 1 January | Japan, Noto Peninsula | 12 000 |
| 3 April | Hualien, Taiwan | 3 000 |
| 1 January | China, Kazakhstan | 420 |
| 3 January | Indonesia | 40 |
| 18 September | Indonesia | 30 |
| 1 April | Indonesia | 10 |
All earthquakes in 2024 are expected to generate an estimated 15 billion USD in economic losses worldwide, with the insurance market likely to be impacted to the tune of 4 billion USD.
Read also | The costliest earthquakes of the last 20 years
Risk mapping: Severe Convective Storms (SCS)
Severe Convective Storms (SCS) are extreme weather phenomena characterized by marked atmospheric instability. These events can generate thunderstorms, wind gusts, hail and, in some cases, tornadoes.
SCS develop when atmospheric humidity is substantial, temperatures are high, and wind speed and direction vary significantly aloft. Because of their rapid formation, often in just a few hours, SCSs are particularly difficult to forecast.
Climate change is making severe convective storms more intense and more frequent.
The consequences of these atmospheric phenomena go far beyond the damage caused by high winds or hail. The lightning associated with these storms poses a high fire hazard, and heavy precipitation can lead to landslides and flooding.
Regions most affected by Severe Convective Storms (SCS)
| Region/Country | Number of SCS in 2023 |
| United States | 49 |
| Canada | 11 |
| China | 7 |
| India | 5 |
| Southeast Asia | 5 |
| Spain | 4 |
| Italy | 3 |
| France | 3 |
| Australia | 2 |
| Germany | 2 |
| Turkey | 2 |
The United States and Canada are the countries most exposed to SCS, due to a combination of meteorological and geographical factors.
The frequent encounter of contrasting air masses (warm winds up from the Gulf of Mexico and cold winds down from Canada), the presence of varied physical features and the proximity of large lakes create unstable conditions conducive to the formation of these systems. Cold fronts, vertical air movements and wind shear are meteorological phenomena that exacerbate these conditions.
The frequency of severe convective storms increased rapidly in Europe in 2023, with 21 such events recorded, mainly in central and southern European countries. Last but not least, in the same year, 23 such events were recorded in Asia.
Severe convective storms: 2023 losses
With 94 billion USD of economic losses, convective storms rank second among natural disasters, just behind earthquakes, which accounted for 99 billion USD of damage in 2023.
In the United States alone, there are 49 SCS with total economic damage amounting to 73 billion USD.
In terms of losses for the insurance market, SCS rank first with 70 billion USD of losses. Floods are in second place with only 13 billion USD, while earthquakes set insurers back only 7 billion USD.
Severe convective storms: losses in 2024
In 2024, severe convective storms generated 75 billion USD in economic losses. In terms of insured losses, as in 2023, SCSs were the costliest natural catastrophe risk for insurers, with a loss of 57 billion USD in 2024.
Major convective storms in 2024
Figures in billions USD
| Date | Countries | Deaths | Economic losses |
| 06-10 May | United States (Oklahoma, Kansas, Tennessee, Alabama, Georgia, Michigan) | 6 | 7 |
| 12-16 March | United States (Illinois, Missouri, Kansas, Oklahoma) | 3 | 5.95 |
| 17-22 May | United States (Texas, Louisiana and Gulf of Mexico) | 5 | 5.4 |
| 25-26 May | United States (Midwest, especially Iowa) | 26 | 3.3 |
| 08-17 April | United Arab Emirates, Oman, Bahrain, Iran | 34 | 3.2 |
| 27-29 May | United States (Pennsylvania, Colorado, Kansas, Oklahoma, Louisiana, Montana, Wyoming) | 2 | 3.1 |
| 13-18 July | United States (New York, South Dakota, Illinois) | 5 | 3.1 |
| 08-10 January | United States (Florida, Southeastern States) | 5 | 2.85 |
| 30 May- 01 June | United States (Texas, Louisiana, Arkansas, Mississippi, Colorado, New Mexico) | 2 | 2.8 |
| 06-12 April | United States (Texas, Louisiana, Mississippi) | 1 | 2.75 |
| 05-06 August | Canada | 0 | 2.7 |
| 29 March-05 April | United States (California, Midwestern States) | 5 | 2.6 |
| 11-14 July | Italy, Germany, Austria, Poland, Slovenia, Belarus | 3 | 1.5 |
Source: Aon- Climate and Catastrophe Insight
Risk mapping: drought, heatwaves and wildfires
Drought is characterized by a prolonged lack of rainfall, which drastically reduces water reserves. This climatic phenomenon, which affects many economic sectors, particularly agriculture, is often associated with heatwaves and forest fires.
Arid conditions in fact make forests vulnerable to fire, turning parched vegetation into fuel ready to burn.
Climate change, mainly caused by man-made greenhouse gas emissions, considerably amplifies the risks and impacts of heatwaves and droughts.
This trio of drought, heatwave and forest fire jeopardizes ecosystems, threatens biodiversity and generates considerable socio-economic costs.
Major wildfires of the last decade
Figures in billions USD
| November 2018 | Camp fire | United States (California) | 16.65 | 10 |
| October 2017 | Tubbs fire | United States (California) | 9.7 | 8.7 |
| November 2018 | Woolsey fire | United States (California) | 6 | 4.2 |
| August 2023 | Maui/Hawaii fire | United States, Hawaiian Islands and Oahu | 5.5 | 3.5 |
| September-October 2020 | Glass fire | United States (California) | 7 | 3 |
Severe drought in 2022 caused economic damage estimated at 26.6 billion USD while insured losses were set at 2.6 billion USD.
Regions most exposed to drought, heatwave and forest fire risks in 2023
In 2023, drought caused economic losses estimated at 45 billion USD, including 14 billion in the United States, 18 billion in the rest of the Americas and 6.4 billion in Asia-Pacific. American insurers were hardest hit by these losses, paying out 6.5 billion USD in claims.
Meanwhile, forest fires caused losses estimated at 11 billion USD in 2023, including 6 billion in the United States. Fires in Hawaii generated insured losses of 3.5 billion USD.
Figures in millions USD
| Region | Event | Countries | Economic losses |
| North America | Drought | United States | 14 000 |
| Heatwave | Southeastern United States, Mexico | NA | |
| Wildfire | United States (Hawaii, Washington, Louisiana) and Canada | 6 090 | |
| South America | Drought | Brazil, Argentina, Uruguay | 87 895 |
| Wildfire | Chile | 900 | |
| Europe | Drought | Spain, France, Austria | 7 260 |
| Wildfire | Spain, Italy, Portugal, Greece, France, Spain | 2 180 | |
| Africa | Wildfire | Algeria | NA |
| Asia | Drought | China, India | 6 300 |
| Wildfire | Russia, Kazakhstan | 50 |
ND : non disponible
Drought, heatwave and forest fire risks: 2024 review
The first half of 2024 broke all heat records, with extreme events multiplying as follows:
- In Mexico, where a historic drought hit 76% of the country, killing 172 people and sparking numerous fires.
- In India, the capital Delhi endured 40 consecutive days of heatwave, with a record temperature of 49.1°C in May.
- In Saudi Arabia, with a record temperature of 51.8°C in Mecca on 17 June, resulting in the deaths of 1 300 pilgrims.
- In southern Africa, a drought that lasted throughout the first half of the year hit Zambia, Zimbabwe, Angola and Botswana hard. Attributed to an El Niño episode, the drought is considered to be the worst to hit the region in decades. This meteorological phenomenon has caused a major humanitarian and agricultural crisis, with economic losses estimated at several hundred million USD.
Risk mapping: winter weather
Being part and parcel of the natural seasonal cycle, winter weather can, nonetheless, turn into a real natural disaster when it lasts longer than normal, or when it reaches exceptional intensity (extremely low temperatures, long episodes of icy conditions, etc.).
These events can cause major damage to infrastructure (roads, bridges, power grids, buildings), the environment (avalanches) and human activities (transport, health, agriculture).
While the link between global warming and heat waves has been established, the link with cold waves is more nuanced. Scientists are currently studying the mechanisms involved. One avenue being explored is the impact of ocean warming on precipitation patterns, and in particular on the formation of cold, wet air masses responsible for snow events. Other, more complex factors could also come into play.
The 2023 winter storms by region
Severe winter weather is common in the USA and Canada, where the 2023 winter was marked by particularly extreme conditions in both countries.
China, meanwhile, experienced severe winter episodes, with a record low temperature of -53°C.
Figures in millions USD
| Date | Countries | Losses |
| 02-05 February | United States, Northeast | 1 850 |
| 13-15 March | United States (California) | 460 |
| 21-22 February | United States (California, Arizona, New-Mexico) | 410 |
| 31 jan-2 February | Southern United States | 385 |
| 05-06 March | Canada | 345 |
| 21-23 February | United States: Midwest, Northeast | 330 |
| 23-25 February | United States (California) | 330 |
| 03-15 March | United States, Northeast | 220 |
| 21/24 April | China | 205 |
| 02-05 February | Canada | 195 |
| 26 February-02 March | United States (California) | 180 |
| 01-28 February | China | 80 |
| 11-25 December | China | 75 |
| 06-08 May | China | 70 |
| 15-16 May | China | 70 |
| 27 March-06 April | Austria | 55 |
| 25-26 December | United States, Plains, Upper Midwest | 50 |
| 11-14 March | China | 50 |
| 13-16 January | China | 40 |
| 23 January | United States, Southeast | 25 |
| 26-27 February | Austria, South East Europe | 15 |
| 24-29 November | United States, Midwest, Northeast | - |
Source: Aon Climate and Catastrophe Insight 2024
The severe winter weather of 2023 caused economic losses of 6 billion USD, to which insurers contributed by disbursing 4 billion USD.
The United States is the country most affected by these weather episodes, with economic losses of 4.24 billion USD, while China records the heaviest human toll, with 590 deaths.
The 2024 winter storms
The weakening of the Antarctic polar vortex allowed cold air to infiltrate higher latitudes, causing frosts in Argentina and cooler temperatures in Africa (Sahel). In Europe, a drop in the jet stream amplified this phenomenon, giving Great Britain its coolest summer since 2015.
In nine months, winter bad weather recorded losses of 9 billion USD by 30 September 2024, up 50% on the full year of 2023.
In the first 9 months of 2024, insurers paid out 4 billion USD in claims, equivalent to the entire previous year.
European windstorms
Powerful cyclones frequently sweep across Europe in autumn and winter. Generated by temperature contrasts between sea and land, four to six storms hit Europe every cold season.
Often originating on the coasts of North America or the Mediterranean, they unleash violent winds and heavy precipitation, causing major damage and economic losses estimated at an average of 2 billion USD per year.
The costliest winter storms in 2023
In 2023, storms in Europe caused economic losses estimated at 5 billion USD, 4 billion USD of which are insured.
Storm Ciarán was the season's major event, causing damage estimated at 2.1 billion USD. It therefore becomes the second most expensive storm since Xynthia, which caused 3.32 billion USD in losses in 2010.
For the record, Europe suffered 28 severe winter storms in 2010.
Figures in millions USD
| Date | Event | Region/country | Deaths | Economic losses |
| 1-2 November | Storm Ciarán | Western Europe | 7 | 2 650 |
| 20-23 October | Storm Aline | Germany, Denmark, Norway, Sweden | 3 | 560 |
| 21-23 December | Storms Zoltan/Pia | Western and Central Europe | 0 | 550 |
| 26-28 November | Storm Bettina | Eastern Europe | 23 | 440 |
| 4-7 November | Storm Domingos | France, Spain | 1 | 275 |
| 31 March | Storm Mathis | Western Europe | 2 | 175 |
| 16 January | Storm Gérard (Gero) | Western Europe | 0 | 110 |
| 05 July | Storm Poly | Western and Central Europe | 2 | 105 |
| 17-18 February | Storm Otto | Western, Northern and Central Europe | 0 | 75 |
| 16-17 January | Storm Fien (Harto) | Western Europe | 1 | 65 |
| 3-4 February | Storm Pit | Central Europe | 0 | 55 |
| 31 December | Storm Geraldine | France | 0 | 55 |
| 22-23 November | Storm Niklas | Northern and Central Europe | 0 | 50 |
| 12 April | Storm Noa | Western Europe | 0 | 45 |
| 16-19 November | Storm Frederico | France | 0 | 40 |
| 27-28 December | Storms Gerrit/Bodo | United Kingdom, Ireland, Norway | 0 | 35 |
| 1 February | Storm Oleg | Germany, Czech Republic, Poland | 0 | 30 |
| 14-15 January | Storm Frederic | Western Europe | 0 | 25 |
| 9-10 December | Storms Elin and Fergus | Western Europe | 0 | 20 |
| 7-10 February | Storm | Northern Europe | 0 | 15 |
| 11 October | Storm Ralf | Finland, Sweden, Norway | 0 | 15 |
| 27-28 February | Storm Juliette | Spain | 0 | 10 |
| 8-13 March | Storm Larisa | Western and Central Europe | 0 | 10 |
| 25-26 March | Storm Khusru | Central Europe, France | 0 | 10 |
Source: Aon Climate and Catastrophe Insight 2024
The costliest winter storms in 2024
By the end of the third quarter of 2024, the total damage caused by European winter storms amounted to 2 billion USD. Half of these losses are covered by insurers.