


- Date of creation: 28 June 1962, Jordan
- Classes of business: Life and non-life
- Rating: A.M. Best: « B+» Stable
Middle East Insurance in 2018
 |
Samir Farhan Khalil Kawar Chairman of the board |
Share capital | 31 100 000 USD |
Turnover | 57 376 203 USD |
Total assets | 121 902 000 USD |
Shareholder’s equity | 55 442 500 USD |
Net result | 2 073 604 USD |
non-life loss ratio | 63.63% |
Non-life management expenses ratio | 16.05% |
Non-life combined ratio | 79.68% |
Management
| Samir Farhan Khalil Kawar | Chairman of the board |
| Rajai Sweis | Chief Executive Officer |
| Mo'nes Haddad | Deputy General Manager, finance |
| Issa Smairat | Assistant General Manager, property and engineering |
| Odeh Abu Dayyeh | Assistant GM, aviation and marine |
| Zakariya Ammar | Assistant GM, life and medical |
| Nabil Anz | Assistant GM, motor |
| Husam Smair | Assistant GM, IT |
Shareholding
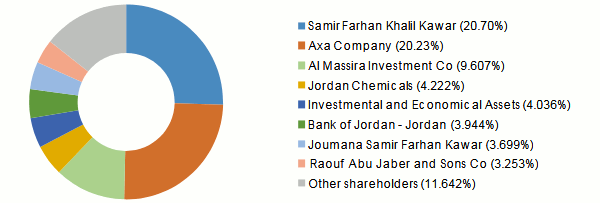 |
Read also | Jordan insurance market
Middle East Insurance: Main technical indicators 2014-2018
Figures in USD| 2014 | 2015 | 2016 | 2017 | 2018 | |
|---|---|---|---|---|---|
Gross written premiums | 53 892 840 | 52 792 829 | 56 381 684 | 57 918 815 | 57 376 203 |
Non-life gross written premiums | 48 073 565 | 47 012 132 | 50 173 104 | 50 793 655 | 49 900 641 |
Written premiums net of reinsurance | 23 273 885 | 23 045 114 | 26 356 402 | 25 778 546 | 26 520 821 |
Non-life earned premiums | 45 892 402 | 47 643 126 | 46 891 300 | 50 250 613 | 51 188 940 |
Non-life gross incurred losses | 30 227 097 | 25 785 582 | 30 677 892 | 28 680 968 | 32 571 079 |
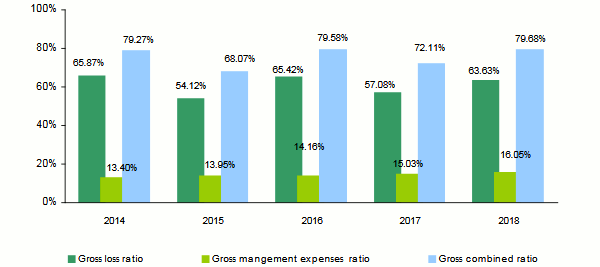
Non-life gross loss ratio (1) | 65.87% | 54.12% | 65.42% | 57.08% | 63.63% |
Non-life management expenses | 6 443 262 | 6 558 215 | 7 102 906 | 7 634 819 | 8 010 636 |
Non-life gross expenses ratio (2) | 13.40% | 13.95% | 14.16% | 15.03% | 16.05% |
Non-life combined ratio (3) | 79.27% | 68.07% | 79.58% | 72.11% | 79.68% |
Net result | 3 107 539 | 3 105 676 | 6 446 809 | 1 635 185 | 2 073 604 |
(1) Non-life gross loss ratio = non-life gross incurred losses / non-life gross earned premiums
(2) Non-life gross management expenses ratio = Non-life gross management expenses / non-life gross written premiums
(3) Non-life gross combined ratio = non-life gross loss ratio+ non-life gross management expenses ratio
Middle East Insurance: Breakdown of turnover per class of business 2014-2018
Figures in USD| Class of business | 2014 | 2015 | 2016 | 2017 | 2018 | 2018 shares |
|---|---|---|---|---|---|---|
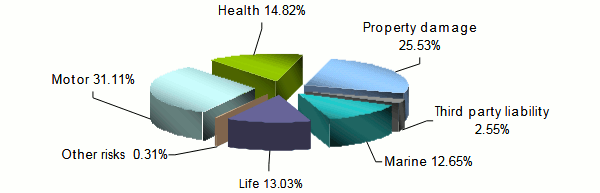
Motor | 16 707 486 | 17 011 552 | 18 758 879 | 18 366 383 | 17 852 008 | 31.11% |
Marine (1) | 9 826 074 | 7 952 160 | 8 061 459 | 7 568 978 | 7 259 734 | 12.65% |
Property damage | 13 659 809 | 13 740 532 | 13 887 759 | 14 465 261 | 14 646 924 | 25.53% |
Third party liability | 1 713 205 | 2 081 228 | 1 343 067 | 1 250 335 | 1 460 515 | 2.55% |
Health | 5 847 233 | 5 911 669 | 7 839 518 | 8 890 306 | 8 501 127 | 14.82% |
Other risks | 319 758 | 314 991 | 282 422 | 252 392 | 180 333 | 0.31% |
Total non-life | 48 073 565 | 47 012 132 | 50 173 104 | 50 793 655 | 49 900 641 | 86.97% |
Life | 5 819 275 | 5 780 697 | 6 208 580 | 7 125 160 | 7 475 562 | 13.03% |
Grand total | 53 892 840 | 52 792 829 | 56 381 684 | 57 918 815 | 57 376 203 | 100% |
(1) including maritime transport and aviation
Breakdown of 2018 turnover per class of business
Middle East Insurance: Gross incurred losses per non-life insurance 2014-2018
Figures in USD| 2014 | 2015 | 2016 | 2017 | 2018 | 2017-2018 evolution | |
|---|---|---|---|---|---|---|
Motor | 17 154 821 | 17 153 756 | 19 168 617 | 20 762 896 | 21 057 871 | 1.14% |
Marine (1) | 1 277 131 | 179 481 | 1 668 496 | 676 378 | 2 461 363 | 262.89% |
Property damage | 7 248 207 | 3 812 704 | 5 142 116 | 443 638 | 1 325 682 | 197.99% |
Third party liability | 174 299 | 229 360 | 112 008 | 346 506 | 391 665 | 12.72% |
Health | 4 280 785 | 4 348 737 | 4 415 371 | 5 771 858 | 7 133 082 | 23.24% |
Other risks | 91 854 | 61 545 | 171 284 | 679 693 | 201 416 | -70.45% |
Total non-life | 30 227 097 | 25 785 582 | 30 677 892 | 28 680 968 | 32 571 079 | 13.25% |
(1) including maritime transport and aviation
Middle East Insurance: Gross earned premiums per non-life insurance 2014-2018
Figures in USD| 2014 | 2015 | 2016 | 2017 | 2018 | 2017-2018 evolution | |
|---|---|---|---|---|---|---|
Motor | 15 884 113 | 16 730 973 | 17 926 002 | 18 847 382 | 17 926 622 | -5.15% |
Marine (1) | 9 781 029 | 7 915 102 | 7 537 214 | 7 841 156 | 7 625 703 | -3.02% |
Property damage | 12 336 585 | 14 619 302 | 13 744 741 | 14 610 560 | 14 937 959 | 1.96% |
Third party liability | 1 686 813 | 1 967 179 | 1 355 896 | 1 277 627 | 1 628 732 | 27.13% |
Health | 5 839 430 | 6 011 134 | 5 994 671 | 7 344 433 | 8 839 896 | 20.03% |
Other risks | 364 431 | 399 437 | 332 776 | 329 456 | 230 027 | -30.37% |
Total non life | 45 892 402 | 47 643 126 | 46 891 300 | 50 250 613 | 51 188 940 | 1.58% |
(1) including maritime transport and aviation
Middle East Insurance: Gross management expenses per class of business 2014-2018
Figures in USD| 2014 | 2015 | 2016 | 2017 | 2018 | 2017-2018 evolution | |
|---|---|---|---|---|---|---|
Motor | 2 447 150 | 2 565 155 | 2 797 662 | 2 929 038 | 2 989 089 | 2.05% |
Marine (1) | 1 172 111 | 968 344 | 1 008 838 | 1 027 816 | 1 066 865 | 3.80% |
Property damage | 1 564 903 | 1 548 225 | 1 593 482 | 1 829 640 | 2 004 108 | 9.54% |
Third party liability | 163 950 | 203 216 | 146 738 | 142 901 | 168 629 | 18% |
Health | 1 032 813 | 1 220 907 | 1 504 316 | 1 657 572 | 1 744 178 | 5.22% |
Other risks | 62 335 | 52 368 | 51 870 | 47 852 | 37 767 | -21.08% |
Total non-life | 6 443 262 | 6 558 215 | 7 102 906 | 7 634 819 | 8 010 636 | 4.92% |
(1) including maritime transport and aviation
Middle East Insurance: Gross loss ratio per non-life insurance 2014-2018
| 2014 | 2015 | 2016 | 2017 | 2018 | |
|---|---|---|---|---|---|
Motor | 108.00% | 102.53% | 106.93% | 110.16% | 117.47% |
Marine (1) | 13.06% | 2.27% | 22.14% | 8.63% | 32.28% |
Property damage | 58.75% | 26.08% | 37.41% | 3.04% | 8.87% |
Third party liability | 10.33% | 11.66% | 8.26% | 27.12% | 24.05% |
Health | 73.31% | 72.34% | 73.65% | 78.59% | 80.69% |
Other risks | 25.20% | 15.41% | 51.47% | 206.31% | 87.56% |
Total non-life | 65.87% | 54.12% | 65.42% | 57.08% | 63.63% |
(1) including maritime transport and aviation
Middle East Insurance: Gross management expenses ratio per non-life insurance 2014-2018
| 2014 | 2015 | 2016 | 2017 | 2018 | |
|---|---|---|---|---|---|
Motor | 14.65% | 15.08% | 14.91% | 15.95% | 16.74% |
Marine (1) | 11.93% | 12.18% | 12.51% | 13.58% | 14.70% |
Property damage | 11.46% | 11.27% | 11.47% | 12.65% | 13.68% |
Third party liability | 9.57% | 9.76% | 10.93% | 11.43% | 11.55% |
Health | 17.66% | 20.65% | 19.19% | 18.64% | 20.52% |
Other risks | 19.49% | 16.63% | 18.37% | 18.96% | 20.94% |
Total non-life | 13.40% | 13.95% | 14.16% | 15.03% | 16.05% |
(1) including maritime transport and aviation
Middle East Insurance: Combined ratio per class of business 2014-2018
| 2014 | 2015 | 2016 | 2017 | 2018 | |
|---|---|---|---|---|---|
Motor | 122.65% | 117.61% | 121.85% | 126.11% | 134.21% |
Marine (1) | 24.99% | 14.44% | 34.65% | 22.21% | 46.97% |
Property damage | 70.21% | 37.35% | 48.89% | 15.68% | 22.56% |
Third party liability | 19.90% | 21.42% | 19.19% | 38.55% | 35.59% |
Health | 90.97% | 93.00% | 92.84% | 97.23% | 101.21% |
Other risks | 44.70% | 32.03% | 69.84% | 225.27% | 108.50% |
Non vie | 79.27% | 68.07% | 79.58% | 72.11% | 79.68% |
(1) including maritime transport and aviation
Evolution of ratios: 2014-2018: 2014-2018
Sources: Middle East Insurance Co and Mubasher.info
Exchange rate JOD/USD as at 31/12 | 2014 | 2015 | 2016 | 2017 | 2018 |
1.40651 | 1.40520 | 1.40641 | 1.40653 | 1.41044 |
Middle East Insurance : Contact
| Head office | Jabal Amman - 3rd Circle - 14 Zahran Street, P.O. Box 1802 - Amman 11 118, Jordan |
| Phone | +962 6 5527100 |
| Fax | +962 6 5527801 |
| Website |