
- Date of creation:
- 1895: creation of Lion of Kenya Insurance Company
- 2012: merger with Insurance Company of East Africa (ICEA)
- Classes of business: Life and non-life insurance, pensions and financial services
- Geographical presence: 21 local agencies
|

ICEA Lion Group Management
| Joseph Wangai | Chairman of the Board of Directors |
| Philip Lopokoiyit | CEO of the Group and of ICEA LION General Insurance |
| George Nyakundi | CEO, ICEA LION Life Assurance |
| Zipporah Chege | Chief Financial Officer (CFO), ICEA LION General Insurance |
| Jane Miuru | Business Director, ICEA LION General Insurance |
| Kevin Nyakeri | Chief Financial Officer (CFO), ICEA LION Life Assurance |
| Gladys Musembi | Business Director, ICEA LION Life Assurance |
ICEA Lion Group Shareholding
| Shareholders (1) | Shares |
| First Chartered Securities (FCS) | 75.9% |
| Autres | 24.1% |
(1) July 2022
ICEA LION General Insurance Company
Is, in 2022:
- a share capital of 8 050 000 USD
- a turnover of 58 780 000 USD
- assets of 127 014 000 USD
- a shareholder’s equity of 53 169 000 USD
- un résultat net de 5 906 000 USD
- a net result of 5 906 000 USD
- a net management expenses ratio of 38.24%
- a net combined ratio of 89.39%
 |
Philip Lopokoiyit CEO of ICEA LION General Insurance |
ICEA LION General Insurance Company: main technical highlights
Figures in thousands USD
| Highlights | 2018 | 2019 | 2020 | 2021 | 2022 |
|---|---|---|---|---|---|
| Gross written premiums | 54 747 | 57 270 | 55 122 | 55 587 | 58 780 |
| Net written premiums | 29 429 | 29 522 | 29 350 | 28 122 | 31 315 |
| Net earned premiums | 29 632 | 27 785 | 28 722 | 28 477 | 28 338 |
| Net incurred losses | 16 027 | 12 278 | 13 472 | 13 755 | 14 495 |
| Management expenses | 12 403 | 12 899 | 11 549 | 11 965 | 11 975 |
| Net loss ratio (1) | 54.09% | 44.19% | 46.90% | 48.30% | 51.15% |
| Net management expenses ratio (2) | 42.15% | 43.69% | 39.35% | 42.55% | 38.24% |
| Net combined ratio (3) | 96.24% | 87.88% | 86.25% | 90.85% | 89.39% |
| Net result | 4 320 | 8 746 | 6 123 | 8 210 | 5 906 |
(1) Net loss ratio = net incurred losses / net earned premiums
(2) Net management expenses ratio = management expenses / net written reinsurance premiums
(3) Net combined ratio = net loss ratio + net management expenses ratio
Exchange rate as at 31/12/2022: 1 KES = 0.00805 USD ; at 31/12/2021: 1 KES = 0.00878 USD ; at 31/12/2020: 1 KES = 0.0091 USD ; at 31/12/2019: 1 KES = 0.00978 USD ; at 31/12/2018: 1 KES = 0.00976 USD.
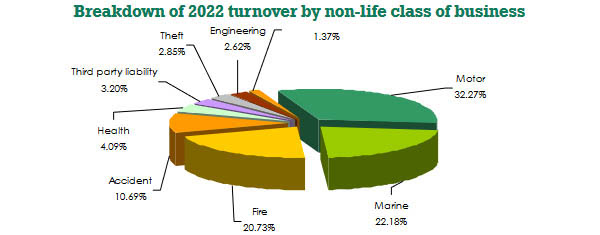
ICEA LION General Insurance Company: turnover breakdown by non-life class of business
Figures in thousands USD
| Classes of business | 2018 | 2019 | 2020 | 2021 | 2022 | 2022 shares |
|---|---|---|---|---|---|---|
| Motor | 14 932 | 17 523 | 16 939 | 18 518 | 18 967 | 32.27% |
| Marine (1) | 15 341 | 13 571 | 14 679 | 11 527 | 13 040 | 22.18% |
| Fire | 9 899 | 10 530 | 9 633 | 11 512 | 12 184 | 20.73% |
| Accidents (2) | 6 423 | 6 846 | 5 264 | 5 051 | 6 284 | 10.69% |
| Health | 2 394 | 1 330 | 2 337 | 2 505 | 2 403 | 4.09% |
| Third party liability | 1 569 | 1 615 | 2 144 | 2 114 | 1 884 | 3.20% |
| Theft | 2 113 | 2 816 | 2 179 | 1 879 | 1 677 | 2.85% |
| Engineering | 1 253 | 1 849 | 1 245 | 1 570 | 1 538 | 2.62% |
| Miscellaneous risks | 823 | 1 190 | 702 | 911 | 803 | 1.37% |
| Non-life total | 54 747 | 57 270 | 55 122 | 55 587 | 58 780 | 100% |
(1) Including marine and aviation
(2) Including personal accident and workmen's compensation
ICEA LION General Insurance Company: net written premiums by non-life class of business
Figures in thousands USD
| Classes of business | 2018 | 2019 | 2020 | 2021 | 2022 | 2021-2022 evolution (1) |
|---|---|---|---|---|---|---|
| Motor | 14 828 | 16 294 | 16 596 | 17 948 | 18 254 | 10.93% |
| Marine (2) | 2 680 | 31 | 2 517 | -713 | 2 319 | 454.73% |
| Fire | 2 432 | 3 127 | 1 963 | 3 201 | 2 881 | -1.86% |
| Accidents (3) | 5 166 | 5 212 | 4 246 | 4 117 | 4 823 | 27.77% |
| Health | 2 187 | 1 050 | 1 252 | 740 | 704 | 3.82% |
| Third party liability | 282 | 496 | 642 | 462 | 271 | -36.06% |
| Theft | 1 788 | 2 205 | 1 645 | 1 652 | 1 423 | -6.03% |
| Engineering | -93 | 858 | 396 | 504 | 396 | -14.33% |
| Miscellaneous risks | 159 | 249 | 93 | 211 | 244 | 25.99% |
| Non-life total | 29 429 | 29 522 | 29 350 | 28 122 | 31 315 | 21.45% |
(1) Evolution in local currency
(2) Including marine and aviation
(3) Including personal accident and workmen's compensation
ICEA LION General Insurance Company: net loss ratio by non-life class of business
| Classes of business | 2018 | 2019 | 2020 | 2021 | 2022 |
|---|---|---|---|---|---|
| Motor | 55.57% | 59.87% | 54.27% | 68.03% | 68% |
| Marine | 31.30% | 18.31% | 50.95% | 41.34% | 10.01% |
| Fire | 44.73% | 21.60% | 54.36% | 14.10% | 45.27% |
| Accidents | 47.59% | 26.64% | 20.81% | -2.81% | 10.59% |
| Health | 107.18% | 85.60% | 96.86% | 65.05% | 101.93% |
| Third party liability | 25.12% | 15.01% | 26.64% | -2.80% | 41.63% |
| Theft | 46.64% | 1.63% | 15.62% | 48.07% | 15.26% |
| Engineering | 54.26% | 44.86% | 34.78% | 58.09% | 28.05% |
| Miscellaneous risks | 57.17% | 12.92% | 1.27% | 13.13% | 7.25% |
| Non-life total | 54.09% | 44.19% | 46.90% | 48.30% | 51.15% |
ICEA LION General Insurance Company: net management expenses ratio by non-life class of business
| Classes of business | 2018 | 2019 | 2020 | 2021 | 2022 |
|---|---|---|---|---|---|
| Motor | 50.02% | 48.08% | 42.44% | 41.65% | 40.67% |
| Marine | 24.56% | 2224.69% | 24.43% | -110.48% | 24.84% |
| Fire | 10.68% | 8.91% | 15% | 13.32% | 21.18% |
| Accident | 40.44% | 40.64% | 45.45% | 45.65% | 42.16% |
| Health | 33.46% | 64.15% | 35.78% | 37.99% | 31.30% |
| Third party liability | 44.93% | 44.17% | 27.67% | 36.78% | 49.43% |
| Theft | 50.29% | 41.86% | 49.87% | 50.72% | 54.06% |
| Engineering | -254.74% | 25.25% | 60.73% | 34.24% | 77.88% |
| Miscellaneous risks | -8.99% | -20.34% | -21.48% | -31.25% | -41.32% |
| Non-life total | 42.15% | 43.69% | 39.35% | 42.55% | 38.24% |
ICEA LION General Insurance Company : net combined ratio by non-life class of business
| Classes of business | 2018 | 2019 | 2020 | 2021 | 2022 |
|---|---|---|---|---|---|
| Motor | 105.59% | 107.95% | 96.71% | 109.68% | 108.67% |
| Marine | 55.86% | 2243% | 75.38% | -69.14% | 34.85% |
| Fire | 55.41% | 30.51% | 69.36% | 27.42% | 66.45% |
| Accidents | 88.03% | 67.28% | 66.26% | 42.84% | 52.75% |
| Health | 140.64% | 149.75% | 132.64% | 103.04% | 133.23% |
| Third party liability | 70.05% | 59.18% | 54.31% | 33.98% | 91.06% |
| Theft | 96.93% | 43.49% | 65.49% | 98.79% | 69.32% |
| Engineering | -200.48% | 70.11% | 95.51% | 92.33% | 105.93% |
| Miscellaneous risks | 48.18% | -7.42% | -20.21% | -18.12% | -34.07% |
| Non-life total | 96.24% | 87.88% | 86.25% | 90.85% | 89.39% |
ICEA LION Life Insurance Company
Is, in 2022:
- a share capital of 9 056 000 USD
- a turnover of 166 637 000 USD
- assets of 1 074 054 000 USD
- a shareholder’s equity of 145 033 000 USD
- a net result of 7 671 000 USD
 |
George Nyakundi CEO of ICEA LION Life Assurance |
ICEA LION Life Insurance Company: main technical highlights
Figures in thousands USD
| Highlights | 2018 | 2019 | 2020 | 2021 | 2022 |
|---|---|---|---|---|---|
| Gross written premiums | 118 232 | 127 540 | 134 865 | 175 604 | 166 637 |
| Net written premiums | 115 490 | 124 767 | 132 270 | 172 857 | 163 876 |
| Management expenses | 15 975 | 18 291 | 18 043 | 18 476 | 14 404 |
| Net management expenses ratio (1) | 13.83% | 14.66% | 13.64% | 10.69% | 8.79% |
| Net result | 4 208 | 4 815 | 5 458 | 5 726 | 7 671 |
(1) Net management expenses ratio = Management expenses / Net written reinsurance premiums
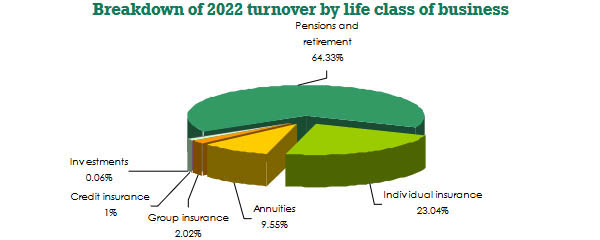
ICEA LION Life Insurance Company: turnover breakdown by life class of business
Figures in thousands USD
| Classes of business | 2018 | 2019 | 2020 | 2021 | 2022 | 2022 shares |
|---|---|---|---|---|---|---|
| Pensions and retirement | 80 447 | 84 702 | 90 702 | 113 528 | 107 197 | 64.33% |
| Individual insurance | 24 461 | 32 300 | 27 679 | 32 163 | 38 395 | 23.04% |
| Annuities | 7 647 | 5 181 | 11 606 | 24 024 | 15 918 | 9.55% |
| Group insurance | 3 178 | 3 116 | 2 969 | 3 989 | 3 359 | 2.02% |
| Credit insurance | 2 136 | 1 964 | 1 745 | 1 773 | 1 668 | 1% |
| Investments | 363 | 277 | 164 | 127 | 100 | 0.06% |
| Life total | 118 232 | 127 540 | 134 865 | 175 604 | 166 637 | 100% |
ICEA Lion Group : contact
| Head office | Riverside Park, Chiromo Road, Westerlands P.O. Box 46143 - 00100, Nairobi, Kenya |
| Phone | +254 719 071 000 / 730 151 000 |
contactcentre@icealion.com | |
| Website |