

Reinsurance hubs: turnover
Although down compared to 2014, when it peaked at 56.6% of the market, Europe remained the world's leading reinsurance market in 2023, with gross written premiums or reinsurance revenue for some reinsurers climbing to 186 billion, or almost 50% of the market total.
Also in 2023, American and Bermudan reinsurers controlled 40% of global underwriting. The remaining 10% is divided between Asia (8.56%), Africa (1.51%) and the Middle East (0.5%).
Figures in millions USD
| Region | 2014 | 2019 | 2022 | 2023 | 2022-2023 evolution | 2023 shares |
| Europe | 117 390 | 159 896 | 173 721 | 186 359 | 7% | 49.23% |
| America and Bermuda | 61 464 | 102 133 | 148 790 | 152 193 | 2% | 40.20% |
| Asia | 23 792 | 43 314 | 33 496 | 32 395 | -3% | 8.56% |
| Africa | 3 690 | 5 054 | 5 815 | 5 712 | -2% | 1.51% |
| Middle East | 958 | 1 191 | 1 655 | 1 884 | 14% | 0.50% |
| Total | 207 294 | 311 588 | 363 477 | 378 543 | 4% | 100% |
Source: Atlas Magazine
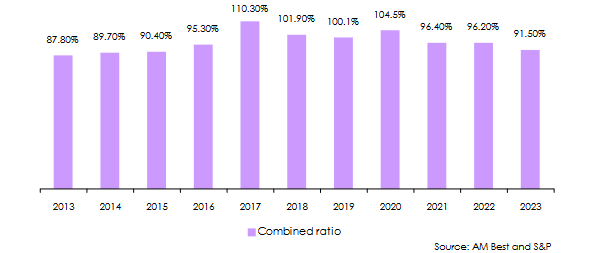
Reinsurance hubs: combined ratio
After a period of high claims from 2017 to 2020, the first signs of market recovery started to show as of 2021. From that date onwards, the combined ratio was below 100%, with a downward trend from 96.4% in 2021, to 96.2% in 2022, reaching 91.5% in 2023.
The strategies of rate readjustment, risk reduction and portfolio diversification may have taken time to put in place, but they have paid off in the end.
The latest combined ratios reveal high profit margins, which put an end, at least temporarily, to reinsurance market concerns about the reserve levels of certain portfolios, particularly those relating to third-party liability risks in the USA.
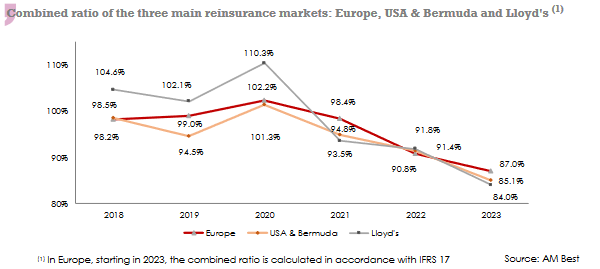
The graph below perfectly illustrates the downward trend in the combined ratios of the world's three major reinsurance markets: Europe, the USA & Bermuda and Lloyd's.
In 2023, the Lloyd's market had the best combined ratio, at 84%, while Europe recorded the highest, at 87%.
Over the period 2018-2023, the Lloyd's market posted the greatest peaks of rates up to 110.3% in 2020. These sudden variations in this market are due to a structural imbalance in the portfolio, which includes many major and specialty risks whose claims experience can be extremely high.
Reinsurance hubs: net income
In 2023, reinsurers posted record profitability, the highest for many years. Two factors are behind this performance.
Firstly, market conditions and the rate increases imposed by reinsurers during recent renewals have paid off.
Secondly, reinsurers have taken advantage of a significant drop in natural catastrophe claims in 2023.
The combination of these two factors means that net income of 77.682 billion USD in 2023 accounts for an exceptional annual increase of 456%. This increase is all the more remarkable in that it comes after a 69.9% drop in 2022 earnings.
The decline in profitability in 2022 was mainly due to the upsurge in natural disasters during the year, as well as high inflation and falling returns on financial markets.
Figures in millions USD
| Region | 2014 | 2019 | 2021 | 2022 | 2023 | 2022-2023 evolution | 2023 shares |
| America and Bermuda | 14 631 | 18 500 | 21 947 | -3 820 | 35 447 | 1028% | 45.60% |
| Europe | 14 535 | 14 210 | 15 062 | 9 268 | 30 946 | 234% | 39.80% |
| Asia | 6 301 | 7 618 | 9 252 | 8 040 | 10 539 | 31% | 13.60% |
| Africa | 347 | 395 | -7 | 303 | 496 | 64% | 0.60% |
| Middle East | 30 | 89 | 117 | 169 | 254 | 49% | 0.30% |
| Total | 35 844 | 40 812 | 46 371 | 13 960 | 77 682 | 456% | 100% |
Source: Atlas Magazine
Net income for all reinsurance markets rose in 2023. The Americas and Bermuda zone posted the highest increase (+1028%). This spectacular recovery is due to the decline in natural catastrophe claims in the United States in 2023, and to improved financial market results.
African reinsurers performed particularly well, posting annual growth of 64%. African results were driven by Africa Re (+112%), Waica Re (+56%) and Continental Re (+95%).
Read also | Ranking of reinsurers by net result
Reinsurance hubs: share capital
Between 2022 and 2023, the share capital of all market players rose less sharply than shareholders' equity, reaching 180 billion USD in the latter year, compared with 172.555 billion USD at the end of 2022, an increase of 4%.
Cumulative share capital in the Americas and Bermuda has fallen by 14% in ten years. At the same time, registered capital in Africa has risen by 46%. Share capital in the Asia and Middle East zones remained more or less unchanged over the 2014 to 2023 period.
Figures in millions USD
| Region | 2014 | 2019 | 2022 | 2023 | 2022-2023 evolution | 2023 shares |
| America and Bermuda | 112 234 | 78 568 | 88 661 | 96 262 | 9% | 53.40% |
| Europe | 31 250 | 51 750 | 57 026 | 56 576 | -1% | 31.40% |
| Asia | 25 149 | 23 619 | 24 526 | 25 136 | 2% | 13.90% |
| Africa | 1 079 | 1 293 | 1 613 | 1 579 | -2% | 0.90% |
| Middle East | 700 | 669 | 729 | 726 | -0.41% | 0.40% |
| Total | 170 412 | 155 899 | 172 555 | 180 279 | 4% | 100% |
Source: Atlas Magazine
Reinsurance hubs: shareholders’ equity
Reinsurers' shareholders' equity continues to grow. From 598 billion USD recorded in 2014, equity rose to 1061 billion USD in 2023. Equity, which has risen by 77.4% in 10 years, is growing at a slower pace than premiums, which have risen by 83% in 10 years.
In a single year, between 2022 and 2023, the increase amounted to 18.91% for the market as a whole. Munich Re (+45%), Lloyd's (+19), Arch Capital (+42%) and Everest Re (+56%) contributed significantly to this growth in shareholders' equity.
The main contributor to this increase, however, remains Berkshire Hathaway, whose equity rose by 17.8%, from 481.6 billion USD to 567.5 billion USD. These results must nevertheless be put into perspective given the particularities of its accounting (1).
As a result, it is the American and Bermudan reinsurers who concentrate the most funds, 73.44% of the global total, followed by Europe and Asia with shares of 16.29% and 9.74% respectively.
The strong growth in shareholders' equity is essentially due to the profits generated by the reinsurers' underwriting business in recent years, and not to an injection of capital by shareholders.
Figures in millions USD
| Region | 2014 | 2019 | 2022 | 2023 | 2022-2023 evolution | 2023 shares |
| America and Bermuda (1) | 369 071 | 611 401 | 648 181 | 778 924 | 20% | 73.44% |
| Europe | 163 761 | 168 550 | 142 439 | 172 814 | 21% | 16.29% |
| Asia | 61 908 | 84 558 | 96 367 | 103 320 | 7% | 9.74% |
| Africa | 2 696 | 3 559 | 3 611 | 3 983 | 10% | 0.38% |
| Middle East | 939 | 1 087 | 1 338 | 1 602 | 20% | 0.15% |
| Total | 598 375 | 869 155 | 891 936 | 1 060 643 | 18.91% | 100% |
Source: Atlas Magazine
(1) Figures for the Americas and Bermuda are biased by data supplied by Berkshire Hathaway. The American conglomerate publishes the group's total shareholders' equity, and not that dedicated solely to reinsurance.
In 2023, the top 10 reinsurers in terms of equity capital totaled 833.983 billion USD, or 78% of the market total. The remaining 133 reinsurers share the remaining 22%.
Berkshire Hathaway alone accounts for 53.5% of the industry's equity capital, followed by Lloyd's of London and Chinese reinsurer PICC, with respective shares of 5.43% and 4.43%.
Read also | Ranking of reinsurers by shareholders' equity
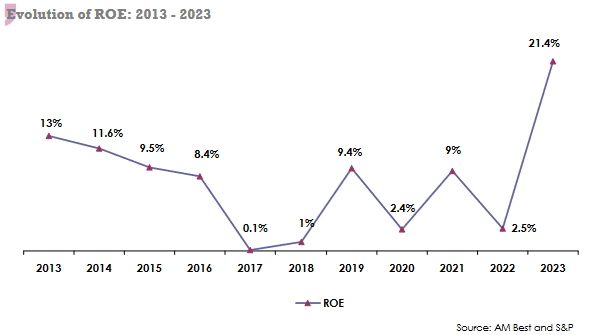
Reinsurance hubs: improved return on equity (ROE)
Thanks to exceptional underwriting results and buoyant financial markets, reinsurers' return on equity (ROE) significantly improved in 2023, with an average rate of 21.4% (1) according to Standard & Poor's, compared with 2.5% in 2022.
The average ROE over the last ten years, from 2013 to 2023, was 8%. This ROE has been penalized on three occasions by the weak financial results reported in 2017, 2018 and 2022.
At corporate level, reinsurers in the USA and Bermuda zone achieved the best average ROE in 2023 (23%), while their European counterparts only achieved 18.6% (2).
To sum up, the improvement in profitability is accounted for by:
- strategic adjustments imposed by reinsurers: higher pricing, higher retention levels, reduced limits offered to cedents, withdrawal from aggregate policies,
- the withdrawal of many insurers and reinsurers from regions and classes of business that have suffered heavy losses. This withdrawal pertains particularly to the US market,
- the high profitability of investment portfolios.
The change in market conditions has not only limited losses due to natural catastrophes and secondary perils, but also strengthened the solvency of reinsurers.
(1) Source: S&P for the entire industry in 2023
(2) Source: AM Best