The Indian insurance market: 2009-2018
The Indian insurance market: evolution of life and non-life premiums
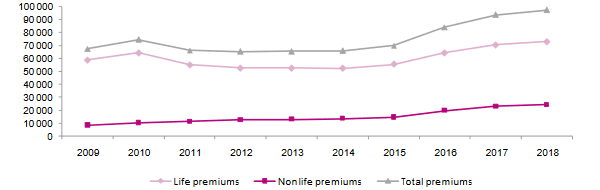
 The indian insurance market turnover has risen from 67.402 billion USD in March 2009 to 97.368 billion USD by late March 2019, a growth rate of 44% in USD.
Life insurance premiums amounted to 73.018 billion USD in March 2019. During the period from 31 March 2009 to 31 March 2019, life revenues had grown by 23.8%, while the life business was shrinking on the market, accounting for just 74.99% of the overall Indian premiums compared to 87.47% in 2009.
The non-life business has, however, skyrocketed to 188% during the 2009-2018, with premiums set at 24.350 billion USD by 31 March 2019 compared to 8.446 billion USD at the end of the year 2008-2009. The market share of non life insurance continued to grow regularly during the past ten years from 12.53% up to 25%.
The prosperous economic situation enjoyed by India during recent years has translated into an increase in per-capita income and in the standards of living. The growth reported by both indicators is likely to boost the development of insurance demand. Regulatory reforms, the evolution of the social landscape and customer needs also stand among the market’s growth drivers.
Evolution of life and non-life premiums: 2009-2018*
In millions USD| 2009 | 2010 | 2011 | 2012 | 2013 | |
|---|---|---|---|---|---|
Life premiums | 58 956 | 64 247 | 55 118 | 52 558 | 52 488 |
Non life premiums | 8 446 | 10 342 | 11 159 | 12 655 | 12 952 |
Total premiums | 67 402 | 74 589 | 66 277 | 65 213 | 65 440 |
| 2014 | 2015 | 2016 | 2017 | 2018 | % 2018 |
|---|---|---|---|---|---|
| 52 332 | 55 335 | 64 487 | 70 519 | 73 018 | 74.99% |
| 13 507 | 14 534 | 19 745 | 23 157 | 24 350 | 25.01% |
| 65 839 | 69 869 | 84 232 | 93 676 | 97 368 | 100% |
* Indicators by March 31: In India, fiscal year starts on 1 April of the year N and ends on 31 March of the year N+1.
For example, the 2018-2019 year starts on 1 April 2018 and ends on 31 March 2019.
The Indian insurance market: Breakdown of premiums per type of company
In millions USD| 2009 | 2010 | 2011 | 2012 | 2013 | |
|---|---|---|---|---|---|
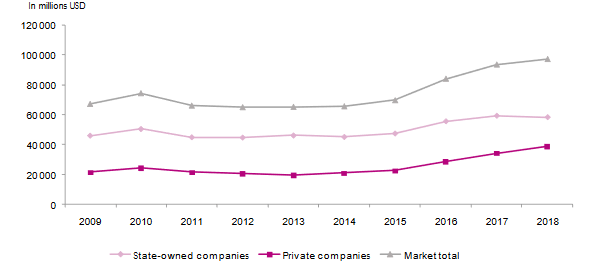
State-owned companies | 45 913 | 50 366 | 44 823 | 44 620 | 46 015 |
Private companies | 21 489 | 24 223 | 21 454 | 20 593 | 19 425 |
Market total | 67 402 | 74 589 | 66 277 | 65 213 | 65 440 |
| 2014 | 2015 | 2016 | 2017 | 2018 | % 2018 |
|---|---|---|---|---|---|
| 45 014 | 47 372 | 55 585 | 59 331 | 58 365 | 59.94% |
| 20 825 | 22 497 | 28 647 | 34 345 | 39 003 | 40.06% |
| 65 839 | 69 869 | 84 232 | 93 676 | 97 368 | 100% |
Evolution of insurance premiums per type of company
Lire aussi | Indian non-life insurance market
The Indian insurance market: Slowdown of public sector
Since the nationalization of life insurance in 1956 and non-life insurance in 1972, State-owned companies have dominated Indian insurance arena. A slowdown of their market share, however, started to take place, especially in the non-life activity. The percentage of the overall premiums controlled by public companies fell from 68.12% in 2009 down to 59.94% in 2018. Approximately, half the overall premiums, and more than 83% of those belonging to public companies were underwritten by a single company, Life Insurance Corporation of India (LIC).
During the period under study, that is, from 2009 to 2018, the premiums underwritten by the public sector had grown by 27%. During the same period, the revenues collected by the private sector had increased by 82%.
The presence of the State in the insurance business is substantial. It is found in the life, non-life and reinsurance sectors. This State presence has contributed in maintaining some kind of market discipline, thus avoiding the shortfalls of an unregulated opening.
Breakdown of life and non life insurance premiums in the public sector
In millions USD| 2009 | 2010 | 2011 | 2012 | 2013 | |
|---|---|---|---|---|---|
Non life State-owned companies | 4 585 | 5 541 | 5 868 | 6 409 | 6 446 |
Life Insurance Coporation of India (LIC) | 41 328 | 44 825 | 38 955 | 38 211 | 39 569 |
Total public sector | 45 913 | 50 366 | 44 823 | 44 620 | 46 015 |
| 2014 | 2015 | 2016 | 2017 | 2018 | % 2018 |
|---|---|---|---|---|---|
| 6 787 | 7 192 | 9 280 | 10 420 | 9 866 | 16.90% |
| 38 227 | 40 180 | 46 305 | 48 911 | 48 499 | 83.10% |
| 45 014 | 47 372 | 55 585 | 59 331 | 58 365 | 100% |
Source: IRDAI
Lire aussi | Indian life insurance market
The Indian insurance market: The booming rise of the private sector
The private companies’ share in the overall premiums collected amounts to 40.06% in 2018 while in 2009, it was set at 31.88%. This growth shall be attributed to the market opening policy that benefited private Indian and foreign investors alike.
Initially focused on the life business, the private sector has gradually diversified its operations. Between 2009 and 2018, the share on the life business in the overall underwritings of the private sector had regressed from 82.03% down to 62.86%. The share on the non-life sector grew by 275%, rising from 17.97% to 37.14% during the same time period.
The growth reported in the life business of the private sector is accounted for by:
- The growing interest shown by the population in innovating products, with the latter providing more and more customized coverage offers, adapted to the budget and consistent with consumer’s needs,
- The responsiveness of private insurers when it comes to processing claim cases,
- The recourse to new technologies in order to gain consumer loyalty, thus establishing a sound customer basis. Consumers are becoming more and more keen on using electronic trade platforms in order to understand, compare and obtain quotes,
- The availability of online insurance packages.
Breakdown of life and non life premiums of the private sector
In millions USD| 2009 | 2010 | 2011 | 2012 | 2013 | |
|---|---|---|---|---|---|
Private life insurance companies | 17 628 | 19 423 | 16 163 | 14 347 | 12 919 |
Private non life insurance companies | 3 104 | 3 837 | 4 284 | 5 115 | 5 346 |
Non life specialized insurers | 518 | 625 | 688 | 815 | 785 |
Stand-Alone Health Insurers | 239 | 338 | 319 | 316 | 375 |
Total non life | 3 861 | 4 800 | 5 291 | 6 246 | 6 506 |
Total private sector | 21 489 | 24 223 | 21 454 | 20 593 | 19 425 |
| 2014 | 2015 | 2016 | 2017 | 2018 | % 2018 |
|---|---|---|---|---|---|
| 14 105 | 15 155 | 18 182 | 21 608 | 24 519 | 62.86% |
| 5 597 | 5 986 | 8 291 | 10 055 | 11 681 | 29.95% |
| 654 | 730 | 1 271 | 1 404 | 1 171 | 3.00% |
| 469 | 626 | 903 | 1 278 | 1 632 | 4.18% |
| 6 720 | 7 342 | 10 465 | 12 737 | 14 484 | 37.14% |
| 20 825 | 22 497 | 28 647 | 34 345 | 39 003 | 100% |
Source : IRDAI