Indian non-life insurance market
 Eventually, these two classes of business are accounting for 68% of non-life premiums. With approximately 7% of property premiums, the fire ranks well ahead of mass risks while marine insurance accounts for only 2% of the premiums during the 2018/2019 year.
The non life premiums underwritten by specialized companies account for 4.81% of the overall market revenues in 2018 and 23.13% of the figure reported by the private sector in non-life risks. These companies are focused on agricultural and credit risks.
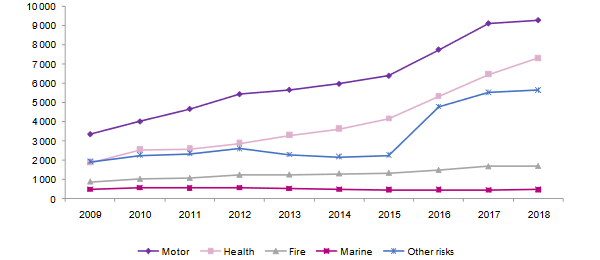
Non-life insurance market in India : Gross written premiums (2009-2018)
| 2009 | 2010 | 2011 | 2012 | 2013 | |
|---|---|---|---|---|---|
Motor | 3 342 | 4 003 | 4 656 | 5 422 | 5 649 |
Health | 1 863 | 2 529 | 2 586 | 2 873 | 3 279 |
Fire | 859 | 1 003 | 1 044 | 1 219 | 1 229 |
Marine | 481 | 555 | 552 | 554 | 528 |
Other risks | 1 901 | 2 252 | 2 321 | 2 587 | 2 267 |
| Total | 8 446 | 10 342 | 11 159 | 12 655 | 12 952 |
| 2014 | 2015 | 2016 | 2017 | 2018 | 2018% | 2009/2018 evolution | |
|---|---|---|---|---|---|---|---|
Motor | 5 962 | 6 379 | 7 744 | 9 106 | 9 272 | 38.08% | 177.44% |
Health | 3 610 | 4 140 | 5 320 | 6 453 | 7 305 | 30% | 292.11% |
Fire | 1 285 | 1 317 | 1 470 | 1 657 | 1 677 | 6.89% | 95.23% |
Marine | 482 | 450 | 450 | 445 | 465 | 1.91% | -3.33% |
Other risks | 2 168 | 2 248 | 4 761 | 5 496 | 5 631 | 23.13% | 196.21% |
| Total | 13 507 | 14 534 | 19 745 | 23 157 | 24 350 | 100% | 188.30% |
Non-life insurance in India: Premiums' evolution
Realated articles:
Non-life insurance market in India: Loss experience
Loss ratio per class of business
Generally, the non-life loss experience of the Indian insurance market is high, with all classes of business reporting loss ratios above 70%. Health, motor and fire are the activities displaying the highest loss ratios.
| 2014 | 2015 | 2016 | 2017 | 2018 | |
|---|---|---|---|---|---|
Motor | 77.14% | 81.18% | 88.17% | 83.45% | 90.60% |
Health | 96.93% | 98.45% | 101.05% | 92.21% | 89.34% |
Fire | 73.78% | 74.44% | 84.38% | 82.35% | 90.48% |
Marine | 67.44% | 72.05% | 74.98% | 65.30% | 84.48% |
Other risks | 73.91% | 75.92% | 81.91% | 78.90% | 82.88% |
| Total | 81.70% | 85.06% | 90.91% | 85.26% | 89.16% |
Related article | India: Loss ratio per non-life insurance company
Non-life insurance market in India: Combined ratio per company
As a logical result of the high loss ratios, combined ratios of the entire non-life market exceed by far the 100% threshold, with the combined ratios of public companies ranging between 116.75% in 2014 and 132.84% in 2018.
Private companies are performing better than the public sector, with all combined ratios also exceeding the 100% bar. The best performance in the private sector was made in 2017 with a ratio of 102.13% while the worst one amounts to 110.74% in 2015. Companies like Stand-Alone Health Insurers (SAHI) also exhibited combined ratios higher than 100%, peaking to 104.18% in 2015.
Related article | India: Combined ratio per non-life insurance company
Non-life insurance market in India: Net result per company
The results of public non-life companies vary from year to year. Indeed, after two consecutive profitable years, all four companies had sustained losses in 2016. They bounced back in 2017 before ending up in 2018 with a 472 million USD deficit.
The results posted by private companies, however, have reported a more or less steady improvement, raising their net profits from 262 million USD in 2014 to 515 million USD five years later.
Related article | Non-life insurance companies in India: net result