CASH Assurances
- Date of creation : 14 January 1996 in Algiers, Algeria
- Class of business: Non-life insurance
- Founders: SONATRACH and CAAR
CASH Assurances in 2018
 |
| Widad Belhouchet |
| Chief executive officer |
Turnover | 80 156 318 USD |
Share capital | 65 286 000 USD |
Shareholder’s equity | 100 724 644 USD |
Assets | 180 787 157 USD |
Technical result | 3 499 982 USD |
Net result | 5 950 735 USD |
Total staff | 640 employees |
Network | 46 agencies |
Management
| Widad Belhouchet | Chief executive officer |
| Mehdi Chellouche | Head of technical division |
| Samy Touhouche | Head of finance and accounting |
| Mira Bettane | Head of administration and human resources |
| Ahmed Haftari | Head of sales |
Shareholding
| SONATRACH Holding SIP | 63.8195% |
| NAFTAL SPA | 11.9646% |
| Compagnie Algérienne d’Assurance et de Réassurance (CAAR) | 18.2318% |
| Compagnie Centrale de Réassurance (CCR) | 5.9841% |
CASH Assurances: Main technical indicators (2014-2018)
Figures in USD| 2014 | 2015 | 2016 | 2017 | 2018 | |
|---|---|---|---|---|---|
Gross written premiums | 136 408 147 | 93 450 442 | 90 253 116 | 93 987 342 | 80 156 318 |
Net written premiums | 20 303 394 | 18 584 431 | 19 639 151 | 17 093 417 | 11 973 461 |
Gross earned premiums | 121 382 358 | 97 626 370 | 93 344 051 | 86 185 123 | 88 642 158 |
Net earned premiums | 17 816 300 | 17 853 671 | 17 284 829 | 20 751 650 | 13 604 924 |
Gross incurred losses (1) | 49 010 612 | 43 155 207 | 30 590 327 | 94 497 017 | -1 889 747 |
Net incurred losses | 8 225 240 | 8 289 430 | 4 762 263 | 10 947 055 | 2 827 135 |
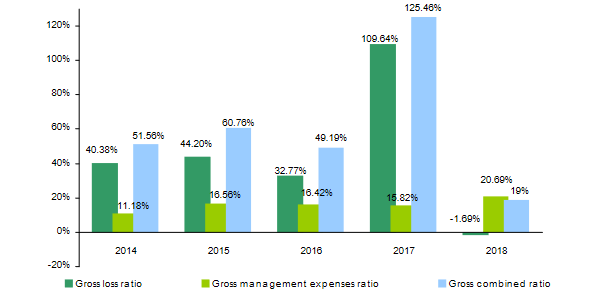
Gross loss ratio (2) | 40.38% | 44.20% | 32.77% | 109.64% | -1.69% (5) |
Management expenses ratio | 15 252 038 | 15 476 137 | 14 823 207 | 14 872 836 | 16 581 229 |
Gross management expenses ratio (3) | 11.18% | 16.56% | 16.42% | 15.82% | 20.69% |
Gross combined ratio (4) | 51.56% | 60.76% | 49.19% | 125.46% | 19% |
Technical result | 9 374 431 | 3 855 136 | 6 300 639 | 1 734 422 | 3 499 982 |
Financial income | 4 075 537 | 4 402 559 | 8 402 537 | 5 546 858 | 7 285 432 |
Net result | 9 278 760 | 4 571 953 | 9 791 996 | 4 340 773 | 5 950 735 |
(1)In 2018, the incurred losses were exceptionally negative due to large valuation discrepancies observed in some major claims
(2) Gross loss ratio = Gross incurred losses/Gross earned premiums
(3) Gross management expenses ratio = Gross management expenses/Gross written premiums
(4) Gross combined ratio = Loss ratio + Management expenses ratio
(5) Atlas estimates
CASH Assurances: Turnover breakdown per class of business (2014-2018) (in DZD)
Figures in thousands DZD| 2014 | 2015 | 2016 | 2017 | 2018 | |
|---|---|---|---|---|---|
Fire | 5 091 469 | 5 376 360 | 5 508 780 | 5 660 455 | 6 561 398 |
Engineering | 4 785 782 | 2 359 330 | 2 027 456 | 3 169 899 | 1 121 972 |
Marine | 888 748 | 809 515 | 764 202 | 654 146 | 622 728 |
Third party liability | 254 560 | 232 533 | 283 536 | 224 191 | 261 045 |
Miscellaneous accident | 52 637 | 50 577 | 55 724 | 47 759 | 45 583 |
Motor | 877 036 | 1 111 340 | 1 277 776 | 1 044 920 | 794 243 |
Natural catastrophes | 89 322 | 119 596 | 99 520 | 102 034 | 169 652 |
Total | 12 039 554 | 10 059 251 | 10 016 994 | 10 903 404 | 9 576 621 |
CASH Assurances: Turnover breakdown per class of business (2014-2018) (in USD)
Figures in USD| 2014 | 2015 | 2016 | 2017 | 2018 | Parts 2018 | |
|---|---|---|---|---|---|---|
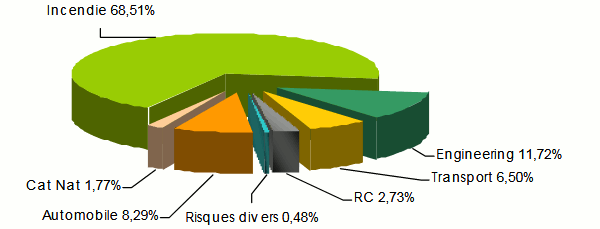
Fire | 57 686 344 | 49 946 384 | 49 634 108 | 48 793 122 | 54 918 901 | 68.51% |
Engineering | 54 222 910 | 21 918 176 | 18 267 379 | 27 324 529 | 9 390 906 | 11.72% |
Marine | 10 069 515 | 7 520 394 | 6 885 460 | 5 638 739 | 5 212 233 | 6.50% |
Third party liability | 2 884 165 | 2 160 232 | 2 554 659 | 1 932 526 | 2 184 947 | 2.73% |
Miscellaneous accident | 596 377 | 469 860 | 502 073 | 411 683 | 381 530 | 0.48% |
Motor | 9 936 818 | 10 324 349 | 11 512 762 | 9 007 210 | 6 647 814 | 8.29% |
Natural catastrophes | 1 012 018 | 1 111 047 | 896 675 | 879 533 | 1 419 987 | 1.77% |
Total | 136 408 147 | 93 450 442 | 90 253 116 | 93 987 342 | 80 156 318 | 100% |
CASH Assurances : Breakdown of 2018 turnover per class of business
CASH Assurances: Gross earned premiums per class of business (2014 - 2018) (in DZD)
Figures in thousands DZD| 2014 | 2015 | 2016 | 2017 | 2018 | |
|---|---|---|---|---|---|
Fire | 5 097 150 | 5 215 505 | 5 480 534 | 5 343 689 | 6 360 916 |
Engineering | 3 542 873 | 2 988 587 | 2 511 919 | 2 471 506 | 2 283 114 |
Marine | 809 741 | 831 561 | 808 957 | 669 019 | 577 358 |
Third party liability | 249 634 | 249 341 | 281 153 | 258 981 | 268 625 |
Miscellaneous accident | 52 203 | 50 152 | 55 236 | 51 101 | 46 735 |
Motor | 882 040 | 1 057 784 | 1 120 093 | 1 104 943 | 904 778 |
Natural catastrophes | 79 718 | 115 829 | 102 158 | 99 035 | 148 935 |
CASH Assurances : Gross earned premiums per class of business (2014 - 2018) (in USD)
Figures in USD| 2014 | 2015 | 2016 | 2017 | 2018 | |
|---|---|---|---|---|---|
Incendie | 57 750 710 | 48 452 041 | 49 379 611 | 46 062 599 | 53 240 867 |
Engineering | 40 140 751 | 27 763 973 | 22 632 390 | 21 304 382 | 19 109 664 |
Transport | 9 174 366 | 7 725 202 | 7 288 703 | 5 766 944 | 4 832 486 |
Responsabilité civile | 2 828 353 | 2 316 378 | 2 533 189 | 2 232 416 | 2 248 391 |
Risques divers | 591 460 | 465 912 | 497 676 | 440 491 | 391 172 |
Automobile | 9 993 513 | 9 826 813 | 10 092 038 | 9 524 609 | 7 572 992 |
Catastrophes naturelles | 903 205 | 1 076 051 | 920 444 | 853 682 | 1 246 586 |
Total | 121 382 358 | 97 626 370 | 93 344 051 | 86 185 123 | 88 642 158 |
CASH Assurances: Gross incurred losses per class of business (2014 - 2018) (in DZD)
Figures in thousands DZD| 2014 | 2015 | 2016 | 2017 | 2018 | |
|---|---|---|---|---|---|
| Fire | 1 400 478 | 2 357 428 | 1 529 346 | 8 702 058 | -1 246 680 |
| Engineering | 1 524 637 | 1 057 569 | 1 268 540 | 507 222 | -226 750 |
| Marine | 398 909 | 791 722 | 684 436 | 1 194 507 | 480 510 |
| Third party liability | 626 276 | 12 381 | -528 632 | 104 484 | 315 204 |
| Miscellaneous accident | 7 305 | 1 412 | 5 436 | 8 771 | 5 185 |
| Motor | 368 133 | 424 828 | 436 027 | 445 489 | 446 755 |
| Total | 4 325 738 | 4 645 340 | 3 395 153 | 10 962 531 | -225 776 |
CASH Assurances: Gross incurred losses per class of business (2014 - 2018) (in USD)
Figures in USD| 2014 | 2015 | 2016 | 2017 | 2018 | |
|---|---|---|---|---|---|
| Fire | 15 867 416 | 21 900 506 | 13 779 407 | 75 011 740 | -10 434 712 |
| Engineering | 17 274 137 | 9 824 816 | 11 429 545 | 4 372 254 | -1 897 898 |
| Marine | 4 519 639 | 7 355 097 | 6 166 768 | 10 296 650 | 4 021 869 |
| Third party liability | 7 095 707 | 115 019 | -4 762 974 | 900 652 | 2 638 257 |
| Miscellaneous accident | 82 766 | 13 117 | 48 978 | 75 606 | 43 398 |
| Motor | 4 170 947 | 3 946 652 | 3 928 603 | 3 840 115 | 3 739 339 |
| Total | 49 010 612 | 43 155 207 | 30 590 327 | 94 497 017 | -1 889 747 |
CASH Assurances : Gross loss ratio per class of business (2014-2018)
| 2014 | 2015 | 2016 | 2017 | 2018 | |
|---|---|---|---|---|---|
Fire | 27.48% | 45.20% | 27.91% | 162.85% | (1) |
Engineering | 43.03% | 35.39% | 50.50% | 20.52% | (1) |
Marine | 49.26% | 95.21% | 84.61% | 178.55% | 83.23% |
Third party liability | 250.88% | 4.97% | <0 | 40.34% | 117.34% |
Miscellaneous accident | 13.99% | 2.82% | 9.84% | 17.16% | 11.09% |
Motor | 41.74% | 40.16% | 38.93% | 40.32% | 49.38% |
Total | 40.38% | 44.20% | 32.77% | 109.64% | -1.69% (2) |
(1) In 2018, the incurred losses were exceptionally negative due to large valuation discrepancies observed in some major claims. The company benefits from significant liquidation bonuses that turn the incurred losses into a gain for the company.
(2) Atlas estimates
CASH Assurances : Evolution of ratios (2014-2018)
Source : CASH Assurances
Exchange rate DZD/USD as at 31/12 | 2014 | 2015 | 2016 | 2017 | 2018 |
0.01133 | 0.00929 | 0.00901 | 0.00862 | 0.00837 |
CASH Assurances : Contact
| Head office | 135, Boulevard des Martyrs, Algiers 16 000 |
| Phone | +213 23 96 70 06 /07/08/09 +213 23 96 70 12/13 |
| Fax | +213 23 96 70 24 |
contact [at] cash-assurances [dot] dz | |
| Website |