Magazine date:
Jul 2020 
- Date of creation: 1 July 1994 in Cairo
- Class of business: Non life
- Rating:
- A.M. Best: B++ (Stable)
- Moody’s: Ba2 (Stable)
GYG Egypt in 2019
 |  |
Raafat Al-Salamony Chairman of the board | Alaa El-Zoheiry Managing director |
Share capital | 17 940 000 USD |
Turnover | 66 373 989 USD |
Assets | 96 092 365 USD |
Shareholder’s equity | 35 685 944 USD |
Net result | 10 862 771 USD |
Loss ratio | 59,22 % |
Management expenses ratio | 26 % |
Combined ratio | 85,22 % |
Management
| Raafat Al-Salamony | Chairman of the board |
| Alaa El-Zoheiry | Managing director |
| Ahmed Shokry | Audit, taxes & collection sector head |
| Mohamed Esmael Khaled | MD Technical assistant |
| Hosam Fouad | Finance sector head |
| Wael Mohamed Roushdy | Marine claims sector head |
| Makeen Lotfy Abdallah | Business & products development sector head |
| Hanna Aly Wahba | Medical insurance department sector head |
Major shareholders
| GIG- Kuwait | 94.85% |
| Suez Canal Bank | 5.00% |
| Egyptian businessmen | 0,15% |
Read also | Top 10 insurance companies in Egypt [4]
GIG Egypt: Major technical highlights (2015-2019)
Figures in USD| 2015 | 2016 | 2017 | 2018 | 2019 | |
|---|---|---|---|---|---|
Gross written premiums | 56 148 208 | 60 567 166 | 41 455 354 | 54 202 763 | 66 373 989 |
Net written premiums | 28 837 773 | 29 309 697 | 16 948 729 | 20 827 977 | 24 811 436 |
Net earned premiums | 26 586 315 | 27 616 041 | 15 595 767 | 18 364 479 | 24 047 399 |
Net incurred losses | 13 051 251 | 15 085 690 | 8 759 778 | 10 584 860 | 14 241 113 |
Loss ratio (1) | 49.09% | 54.63% | 56.17% | 57.64% | 59.22% |
Management expenses | 15 690 814 | 16 511 837 | 10 395 544 | 13 095 306 | 17 257 553 |
Management expenses ratio (2) | 27.95% | 27.26% | 25.08% | 24.16% | 26.00% |
Combined ratio (3) | 77.04% | 81.89% | 81.25% | 81.80% | 85.22% |
Net result | 9 566 685 | 8 666 514 | 6 429 740 | 7 082 654 | 10 862 771 |
(1) Loss ratio = incurred losses / earned premiums
(2) Management expenses ratio = management expenses / written premiums
(3) Combined ratio = loss ratio + management expenses ratio
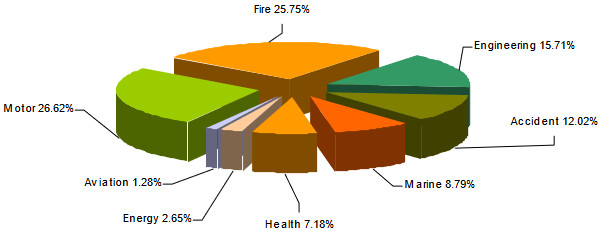
GIG Egypt: Breakdown of turnover per class of business (2015-2019)
Figures in USD| 2015 | 2016 | 2017 | 2018 | 2019 | Evolution 2018-2019 (1) | Parts 2019 | |
|---|---|---|---|---|---|---|---|
Motor | 24 103 175 | 24 825 231 | 13 256 514 | 14 646 459 | 17 671 423 | 12.60% | 26.62% |
Fire | 9 297 683 | 10 564 195 | 11 892 429 | 14 161 423 | 17 092 530 | 12.64% | 25.75% |
Engineering | 6 842 966 | 8 243 491 | 5 312 096 | 7 831 498 | 10 424 443 | 24.23% | 15.71% |
Accident | 6 147 618 | 6 646 220 | 5 010 795 | 6 475 181 | 7 974 771 | 14.94% | 12.02% |
Marine (2) | 6 492 191 | 5 523 693 | 3 041 285 | 4 728 779 | 5 831 805 | 15.10% | 8.79% |
Health | 380 968 | 1 945 297 | 1 331 448 | 3 571 728 | 4 766 330 | 24.54% | 7.18% |
Energy | 2 275 476 | 2 279 470 | 1 349 359 | 2 149 180 | 1 760 483 | -23.55% | 2.65% |
Aviation | 608 131 | 539 569 | 261 428 | 638 515 | 852 204 | 24.56% | 1.28% |
| Total | 56 148 208 | 60 567 166 | 41 455 354 | 54 202 763 | 66 373 989 | 14.28% | 100% |
(1) Evolution in local currency (2) Including marine and inland transportation
Breakdown of 2019 turnover per class of business
GIG Egypt: Net earned premiums per class of business (2015-2019)
Figures in USD| 2015 | 2016 | 2017 | 2018 | 2019 | Evolution 2018-2019 (1) | |
|---|---|---|---|---|---|---|
Motor | 19 222 807 | 20 590 300 | 11 267 903 | 11 879 864 | 14 368 529 | 12.88% |
Fire | 1 132 993 | 1 250 236 | 711 093 | 952 113 | 1 417 103 | 38.91% |
Engineering | 1 388 213 | 1 305 137 | 941 388 | 1 033 231 | 1 734 708 | 56.69% |
Accident | 3 005 720 | 2 628 925 | 1 451 089 | 2 074 984 | 2 768 612 | 24.53% |
Marine (2) | 1 710 352 | 1 381 557 | 835 749 | 1 086 231 | 1 402 157 | 20.47% |
Health | 59 748 | 347 538 | 327 385 | 1 294 557 | 2 333 442 | 68.22% |
Energy | 61 484 | 107 013 | 59 159 | 42 180 | 22 116 | -51.07% |
Aviation | 4 998 | 5 335 | 2 001 | 1 319 | 732 | -48.21% |
| Total | 26 586 315 | 27 616 041 | 15 595 767 | 18 364 479 | 24 047 399 | 22.21% |
GIG Egypt: Net incurred losses per class of business (2015-2019)
Figures in USD| 2015 | 2016 | 2017 | 2018 | 2019 | Evolution 2018-2019 (1) | |
|---|---|---|---|---|---|---|
Motor | 10 591 823 | 13 027 522 | 7 221 884 | 7 957 238 | 9 238 887 | 8.36% |
Fire | 466 959 | 351 516 | 221 957 | 404 189 | 676 173 | 56.13% |
Engineering | 840 604 | 480 682 | 623 396 | 668 910 | 1 094 115 | 52.65% |
Accident | 776 244 | 494 397 | 224 364 | 325 357 | 659 846 | 89.28% |
Marine (2) | 369 336 | 341 748 | 138 358 | 251 056 | 282 142 | 4.88% |
Health | 11 638 | 312 886 | 326 648 | 979 214 | 2 290 224 | 118.28% |
Energy | -3 676 | 68 605 | -2 801 | - | - | - |
Aviation | -1 677 | 8 334 | 5 972 | -1 104 | -274 | -76.88% |
| Total | 13 051 251 | 15 085 690 | 8 759 778 | 10 584 860 | 14 241 113 | 25.57% |
(1) Evolution in local currency (2) Including marine and inland transportation
GIG Egypt: Management expenses per class of business (2015-2019)
Figures in USD| 2015 | 2016 | 2017 | 2018 | 2019 | Evolution 2018-2019 (1) | |
|---|---|---|---|---|---|---|
Motor | 6 619 108 | 6 715 047 | 3 679 244 | 4 264 039 | 5 794 754 | 26.83% |
Fire | 2 564 637 | 2 883 501 | 2 227 375 | 2 806 598 | 3 503 460 | 16.50% |
Engineering | 1 817 499 | 2 234 965 | 1 366 387 | 1 678 036 | 2 623 635 | 45.92% |
Accident | 1 870 184 | 1 772 825 | 1 382 671 | 1 867 985 | 2 288 262 | 14.33% |
Marine (2) | 1 994 439 | 1 726 208 | 1 006 585 | 1 355 343 | 1 594 063 | 9.77% |
Health | 194 556 | 491 219 | 333 388 | 725 350 | 1 075 710 | 38.41% |
Energy | 555 131 | 614 154 | 364 136 | 314 465 | 250 622 | -25.62% |
Aviation | 75 260 | 73 918 | 35 758 | 83 490 | 127 047 | 42.02% |
| Total | 15 690 814 | 16 511 837 | 10 395 544 | 13 095 306 | 17 257 553 | 22.99% |
(1) Evolution in local currency (2) Including marine and inland transportation
GIG Egypt: Loss ratio per class of business (2015-2019)
| 2015 | 2016 | 2017 | 2018 | 2019 | |
|---|---|---|---|---|---|
Motor | 55.10% | 63.27% | 64.09% | 66.98% | 64.30% |
Fire | 41.21% | 28.12% | 31.21% | 42.45% | 47.72% |
Engineering | 60.55% | 36.83% | 66.22% | 64.74% | 63.07% |
Accident | 25.83% | 18.81% | 15.46% | 15.68% | 23.83% |
Marine (1) | 21.59% | 24.74% | 16.55% | 23.11% | 20.12% |
Health | 19.48% | 90.03% | 99.77% | 75.64% | 98.15% |
Energy | -5.98% | 64.11% | -4.74% | - | - |
Aviation | -33.54% | 156.23% | 298.45% | -83.69% | -37.43% |
| Total | 49.09% | 54.63% | 56.17% | 57.64% | 59.22% |
(1) Including marine and inland transportation
GIG Egypt: Management expenses ratio per class of business (2015-2019)
| 2015 | 2016 | 2017 | 2018 | 2019 | |
|---|---|---|---|---|---|
Motor | 27.46% | 27.05% | 27.75% | 29.11% | 32.79% |
Fire | 27.58% | 27.30% | 18.73% | 19.82% | 20.50% |
Engineering | 26.56% | 27.11% | 25.72% | 21.43% | 25.17% |
Accident | 30.42% | 26.67% | 27.59% | 28.85% | 28.69% |
Marine | 30.72% | 31.25% | 33.10% | 28.66% | 27.33% |
Health | 51.07% | 25.25% | 25.04% | 20.31% | 22.57% |
Energy | 24.40% | 26.94% | 26.99% | 14.63% | 14.24% |
Aviation | 12.38% | 13.70% | 13.68% | 13.08% | 14.91% |
| Total | 27.95% | 27.26% | 25.08% | 24.16% | 26% |
GIG Egypt: Combined ratio per class of business (2015-2019)
| 2015 | 2016 | 2017 | 2018 | 2019 | |
|---|---|---|---|---|---|
Motor | 82.56% | 90.32% | 91.84% | 96.09% | 97.09% |
Fire | 68.79% | 55.42% | 49.94% | 62.27% | 68.22% |
Engineering | 87.11% | 63.94% | 91.94% | 86.17% | 88.24% |
Accident | 56.25% | 45.48% | 43.05% | 44.53% | 52.52% |
Marine | 52.31% | 55.99% | 49.65% | 51.77% | 47.45% |
Health | 70.55% | 115.28% | 124.81% | 95.95% | 120.72% |
Energy | 18.42% | 91.05% | 22.25% | 14.63% | 14.24% |
Aviation | -21.16% | 169.93% | 312.13% | -70.61% | -22.52% |
| Total | 77.04% | 81.89% | 81.25% | 81.80% | 85.22% |
Exchange rate EGP/USD as at 31/12 | 2015 | 2016 | 2017 | 2018 | 2019 |
0.13 | 0.11285 | 0.0551 | 0.05581 | 0.0598 |

GIG Egypt: Contact
| Siège social | 13 Ma'ahad Ishteraki St., Merryland, Heliopolis - Cairo, Egypt |
| Phone | (+20) 2 4517620 / (+20) 2 4517622 / (+20) 2 4517624 |
mail [at] gig [dot] com [dot] eg | |
| Website | www.gig.com.eg [5] |