
- Date of creation: 16 May 1978, Al Sharjah, United Arab Emirates
- Classes of business: Life and non-life
- Rating: Standard & Poor’s / BB / Negative
- Regional structures: 26 entities
ABNIC in 2022
|

Management
| Faisal Bin Khalid Bin Sultan Al Qasimi | Chairman of the Board of Directors |
| Khaled Bin Abdulla Sultan Al Qasimi | Group Managing Director |
| Nader Tawfiq Al Qaddumi | Group CEO |
| Issam Mehdawi | Assistant General Manager, accidents and fire |
| Nabil Shanawani | Assistant General Manager, health |
| Salah F. Daou | Assistant General Manager, finance |
Shareholding as at 31/12/2022
| Shareholders | Shares |
| Salem Abdullah Salem Al Hosani | 16.3553% |
| Abdullah Bin Mohamed Ali Al Thani | 13.4686% |
| Faisal Bin Khalid Bin Sultan Al Qassimi | 12.3797% |
| FAB Private Bank (Switzerland) SA | 10% |
| Umm Al Qaiwain General Investment Co PSC | 9.8% |
| Soha Almi Fawzy Al Nabolsy | 9.292% |
| Others | 28.7044% |
ABNIC: main technical highlights
Figures USD
| Highlights | 2018 | 2019 | 2020 | 2021 | 2022 |
|---|---|---|---|---|---|
| Gross written premiums | 132 523 936 | 235 947 894 | 247 604 978 | 244 384 089 | 256 671 182 |
| Gross non-life written premiums | 129 688 192 | 233 221 544 | 245 222 994 | 240 557 844 | 253 817 062 |
| Gross life written premiums | 2 835 744 | 2 726 350 | 2 381 984 | 3 826 245 | 2 854 120 |
| Net written premiums | 51 583 944 | 48 463 651 | 50 569 369 | 70 286 629 | 71 562 234 |
| Net non-life written premiums | 51 450 485 | 48 065 305 | 50 390 789 | 70 028 635 | 71 166 463 |
| Net earned premiums | 58 302 761 | 51 262 121 | 51 570 792 | 68 120 781 | 70 639 220 |
| Net non-life earned premiums | 58 100 070 | 50 981 210 | 51 479 664 | 67 781 888 | 70 202 078 |
| Net non-life incurred losses | 45 276 423 | 43 789 846 | 34 833 924 | 62 001 822 | 73 184 780 |
| Non-life management expenses | 14 389 266 | 14 568 017 | 14 984 001 | 15 395 521 | 16 046 824 |
| Net non-life loss ratio (1) | 77.93% | 85.89% | 67.67% | 91.47% | 104.25% |
| Non-life management expenses ratio (2) | 27.97% | 30.31% | 29.74% | 21.98% | 22.55% |
| Net non-life combined ratio (3) | 105.90% | 116.20% | 97.41% | 113.45% | 126.80% |
| Net result | 9 664 912 | 6 006 766 | 6 529 237 | 6 814 899 | -9 390 515 |
(1) Net non-life loss ratio = Net non-life incurred losses / Net non-life earned premiums
(2) Net non-life management expenses ratio = Non-life management expenses/ Net non-life written premiums
(3) Net non-life combined ratio = Net non-life loss ratio + Net non-life management expenses ratio
Exchange rate as at 31/12/2022: 1 AED = 0.27224 USD ; 31/12/2021: 1 AED = 0.27222 USD ; 31/12/2020: 1 AED = 0.27222 USD ; 31/12/2019: 1 AED = 0.27221 USD ; at 31/12/2018: 1 AED = 0.27227 USD
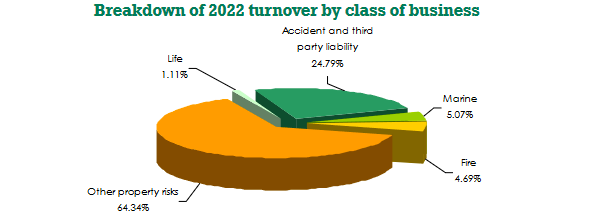
ABNIC: turnover breakdown by class of business
Figures in thousands USD
| Classes of business | 2018 | 2019 | 2020 | 2021 | 2022 | 2022 shares |
|---|---|---|---|---|---|---|
| Accident and third-party liability | 77 330 | 80 391 | 80 779 | 74 603 | 63 634 | 24.79% |
| Marine | 11 172 | 9 205 | 10 815 | 11 546 | 13 013 | 5.07% |
| Fire | 10 456 | 13 949 | 14 398 | 12 178 | 12 035 | 4.69% |
| Other property risks | 30 731 | 129 677 | 139 231 | 142 231 | 165 135 | 64.34% |
| Non-life total | 129 688 | 233 222 | 245 223 | 240 558 | 253 817 | 98.89% |
| Life total | 2 836 | 2 726 | 2 382 | 3 826 | 2 854 | 1.11% |
| Grand total | 132 524 | 235 948 | 247 605 | 244 384 | 256 671 | 100% |
ABNIC: net written premiums by class of business
Figures in thousands USD
| Class of business | 2018 | 2019 | 2020 | 2021 | 2022 | 2021-2022 evolution (1) |
|---|---|---|---|---|---|---|
| Accident and third-party liability | 40 214 | 25 500 | 22 645 | 32 299 | 22 237 | -31.16% |
| Marine | 1 244 | 1 422 | 3 141 | 3 934 | 4 671 | 18.73% |
| Fire | 1 091 | 1 981 | 2 340 | 1 606 | 1 080 | -32.76% |
| Other property risks | 8 901 | 19 163 | 22 264 | 32 189 | 43 178 | 34.13% |
| Non-life total | 51 450 | 48 065 | 50 391 | 70 029 | 71 166 | 1.62% |
| Life total | 133 | 398 | 179 | 258 | 396 | 53.39% |
| Grand total | 51 584 | 48 464 | 50 569 | 70 287 | 71 562 | 1.81% |
(1) Evolution in local currency
ABNIC: net earned premiums by class of business
Figures in thousands USD
| Class of business | 2018 | 2019 | 2020 | 2021 | 2022 | 2021-2022 evolution (1) |
|---|---|---|---|---|---|---|
| Accident and third-party liability | 39 778 | 28 929 | 25 017 | 30 726 | 24 563 | -20.06% |
| Marine | 1 532 | 1 440 | 2 672 | 3 384 | 4 534 | 33.98% |
| Fire | 915 | 1 604 | 2 247 | 1 893 | 1 354 | -28.48% |
| Other property risks | 15 875 | 19 007 | 21 544 | 31 779 | 39 752 | 25.08% |
| Non-life total | 58 100 | 50 981 | 51 480 | 67 782 | 70 202 | 3.56% |
| Life total | 203 | 281 | 91 | 339 | 437 | 28.98% |
| Grand total | 58 303 | 51 262 | 51 571 | 68 121 | 70 639 | 3.69% |
(1) Evolution in local currency
ABNIC: net incurred losses by non-life class of business
Figures in thousands USD
| Class of business | 2018 | 2019 | 2020 | 2021 | 2022 | 2021-2022 evolution (1) |
|---|---|---|---|---|---|---|
| Accident and third-party liability | 28 014 | 21 171 | 16 497 | 27 381 | 30 119 | 9.99% |
| Marine | 899 | 865 | 1 282 | 1 061 | 1 651 | 55.59% |
| Fire | 754 | 1 270 | 1 013 | 3 042 | 1 247 | -59.01% |
| Other property risks | 15 609 | 20 484 | 16 043 | 30 518 | 40 168 | 31.61% |
| Non-life total | 45 276 | 43 790 | 34 834 | 62 002 | 73 185 | 18.03% |
(1) Evolution in local currency
ABNIC: management expenses by non-life class of business
Figures in thousands USD
| Class of business | 2018 | 2019 | 2020 | 2021 | 2022 | 2021-2022 evolution (1) |
|---|---|---|---|---|---|---|
| Accident and third-party liability | 8 488 | 8 501 | 7 002 | 6 808 | 6 459 | -5.14% |
| Marine | 1 509 | 1 310 | 1 478 | 2 213 | 2 074 | -6.28% |
| Fire | 1 440 | 1 501 | 1 297 | 892 | 967 | 8.41% |
| Other property risks | 2 953 | 3 257 | 5 207 | 5 483 | 6 547 | 19.40% |
| Non-life total | 14 389 | 14 568 | 14 984 | 15 396 | 16 047 | 4.22% |
(1) Evolution in local currency
ABNIC: net loss ratio by non-life class of business
| Classes of business | 2018 | 2019 | 2020 | 2021 | 2022 |
|---|---|---|---|---|---|
| Accident and third-party liability | 70.43% | 73.18% | 65.94% | 89.11% | 122.62% |
| Marine | 58.66% | 60.05% | 47.98% | 31.36% | 36.41% |
| Fire | 82.43% | 79.20% | 45.06% | 160.74% | 92.14% |
| Other property risks | 98.33% | 107.77% | 74.46% | 96.03% | 101.05% |
| Non-life total | 77.93% | 85.89% | 67.67% | 91.47% | 104.25% |
ABNIC: net management expenses ratio by non-life class of business
| Classes of business | 2018 | 2019 | 2020 | 2021 | 2022 |
|---|---|---|---|---|---|
| Accident and third-party liability | 21.11% | 33.33% | 30.92% | 21.08% | 29.05% |
| Marine | 121.26% | 92.13% | 47.05% | 56.25% | 44.40% |
| Fire | 131.92% | 75.78% | 55.42% | 55.52% | 89.51% |
| Other property risks | 33.18% | 16.99% | 23.39% | 17.03% | 15.16% |
| Non-life total | 27.97% | 30.31% | 29.74% | 21.98% | 22.55% |
ABNIC: net combined ratio by non-life class of business
| Classes of business | 2018 | 2019 | 2020 | 2021 | 2022 |
|---|---|---|---|---|---|
| Accident and third-party liability | 91.54% | 106.51% | 96.86% | 110.19% | 151.67% |
| Marine | 179.92% | 152.18% | 95.03% | 87.61% | 80.81% |
| Fire | 214.35% | 154.98% | 100.48% | 216.26% | 181.65% |
| Other property risks | 131.51% | 124.76% | 97.85% | 113.06% | 116.21% |
| Non-life total | 105.90% | 116.20% | 97.41% | 113.45% | 126.80% |

ABNIC: Contact
| Head office | 6th Floor, Al Buhaira Tower, Buhaira Corniche, P.O. Box 6000, Sharjah, United Arab Emirates |
| Phone | +971 6 5174444 |
| Fax | +971 6 5748855 |
gm [at] albuhaira [dot] com | |
| Website |