 Unfortunately, back then, the economic context was hardly inciting for such risk taking. In 2009, the global market was still struggling in the financial crisis of 2008 and the numerous financial scandals like subprime or the bankruptcy of AIG which also occurred in 2008.
The gloomy economic context crippled the start of the new reinsurer which would be struggling to find its market. As often happens in times of crisis, the scarcity of premiums prompts investors to take excessive risks by accepting treaties and facultatives at degraded conditions. Newly established and in search of premium, Oman Re was not immune from this scenario of end of cycle. Its underwritings during the 2009-2011 period, mainly those pertaining to fire and marine classes of business were particularly unprofitable.
In 2013, contrary to expectations, initial results pushed shareholders to restructure the company and hire a new management team. Full review of the portfolio and an overhaul of procedures as well as premiums and claims ensued. This truth transaction that was completed in late 2014 gave way to a new underwriting policy. First sign of this renewal was the results for the first half 2015 that turned green.
Thanks to its strategic geographical location, today Oman Re is particularly targeting African markets and to a lesser extent those in Asia. In Africa, an area hardly exposed to major natural and man-made catastrophes, the experience of the current management team is a significant asset.
 |  |
| Abdullah Bin Zahran Al Balushi | Abdallah Badaoui |
| Chairman of the board | CEO |
Oman Re in 2014
| Share capital | 78 000 000 USD |
| Turnover | 14 536 000 USD |
| Total assets | 114 000 000 USD |
| Shareholder's equity | 61 000 000 USD |
| Net loss | 9 106 000 USD |
| Net loss ratio | 169.8% |
| Number of employees | 30 |
Board of directors and management
| Chairman of the board | Abdullah Bin Zahran Al Balushi |
| CEO | Abdallah Badaoui |
| Corporate services chief officer | Ahmed Ibrahim |
| Finance manager | Sanjay Kampani |
| Senior underwriter | Krishna Moorthy |
| Underwriter | Malek Mechouet |
| Risk manager | Vijayabalan |
Main shareholders
| Trust Re | 24.5% |
| Qatar General insurance & reinsurance Co. | 24.5% |
| Omar Zawawi | 15.5% |
| Zawawi Trading | 9.5% |
| Ziliano Investment | 10% |
Main technical highlights: 2010-2014
in thousands USD| 2010 | 2011 | 2012 | 2013 | 2014 | |
|---|---|---|---|---|---|
Gross written premiums | 16 917 | 21 197 | 18 376 | 15 308 | 14 536 |
Net earned premiums | 6 488 | 11 446 | 11 277 | 9 314 | 6 847 |
Net incurred losses | -2 668 | - 6 695 | - 9 237 | - 8 330 | - 11 627 |
Management expenses | - 1 488 | - 1 587 | - 1 948 | - 2 029 | - 2 699 |
Net loss ratio | 41.1% | 58.5% | 81.9% | 89.4% | 169.8% |
Financial income | 488 | 538 | 403 | 1 519 | 1 325 |
Net result | 940 | 145 | - 2 208 | - 3 148 | - 9106 |
Evolution of premiums, losses and results: 2010-2014
in thousands USD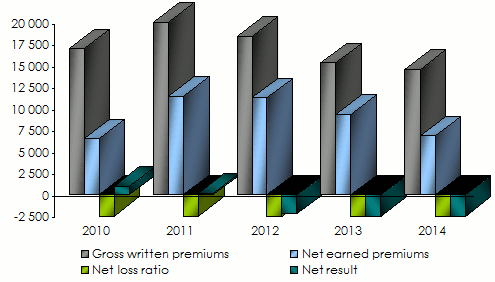
Breakdown of turnover per class of business: 2010-2014
in thousands USD| 2010 | 2011 | 2012 | 2013 | 2014 | 2014 shares | |
|---|---|---|---|---|---|---|
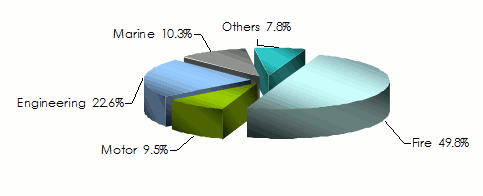
Fire | 6 712 | 9 021 | 9 704 | 7 384 | 7 242 | 49.8% |
Motor | 1 491 | 2 496 | 1 948 | 1 439 | 1 384 | 9.5% |
Engineering | 3 860 | 3 114 | 2 309 | 2 226 | 3 286 | 22.6% |
Marine | 3 522 | 3 418 | 3 109 | 2 275 | 1 499 | 10.3% |
Others | 1 332 | 3 148 | 1 306 | 1 984 | 1 125 | 7.8% |
Total | 16 917 | 21 197 | 18 376 | 15 308 | 14 536 | 100% |
Breakdown of 2014 turnover per class of business
Net earned premiums per class of business: 2010-2014
in thousands USD| 2010 | 2011 | 2012 | 2013 | 2014 | |
|---|---|---|---|---|---|
Fire | 1 849 | 3 319 | 3 714 | 2 779 | 2 208 |
Motor | 992 | 1 875 | 2 184 | 1 613 | 1 358 |
Engineering | 883 | 686 | 1 158 | 1 145 | 483 |
Marine | 1 951 | 3 319 | 2 647 | 2 265 | 1 434 |
Others | 813 | 2 247 | 1 574 | 1 512 | 1 364 |
Total | 6 488 | 11 446 | 11 277 | 9 314 | 6 847 |
Net incurred losses per class of business: 2010-2014
in thousands USD| 2010 | 2011 | 2012 | 2013 | 2014 | |
|---|---|---|---|---|---|
Fire | -1 629 | -1 951 | -2 987 | -2 826 | - 4 481 |
Motor | -145 | -1 668 | -2 187 | -1 758 | - 1 294 |
Engineering | -119 | -348 | -886 | -1 668 | - 1 436 |
Marine | -704 | - 1 938 | - 2 125 | - 779 | - 2 130 |
Others | -71 | -790 | -1 052 | -1 299 | -2 286 |
Total | - 2 668 | - 6 695 | - 9 237 | - 8 330 | - 11 627 |
Net loss ratios per class of business: 2010-2014
| 2010 | 2011 | 2012 | 2013 | 2014 | |
|---|---|---|---|---|---|
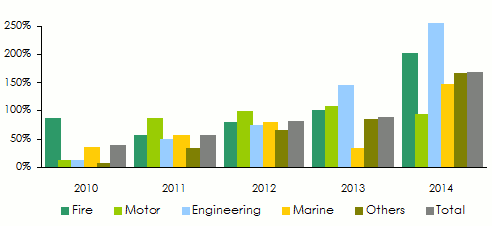
Fire | 88.1% | 58.8% | 80.4% | 101.7% | 202.9% |
Motor | 14.6% | 88.9% | 100.1% | 109% | 95.2% |
Engineering | 13.5% | 50.8% | 76.5% | 145.6% | 297.3% |
Marine | 36.1% | 58.4% | 80.3% | 34.4% | 148.6% |
Others | 8.7% | 35.2% | 66.8% | 85.9% | 167.6% |
Total | 41.1% | 58.5% | 81.9% | 89.4% | 169.8% |
Evolution of net loss ratios per class of business: 2010-2014
 Source: Figures extracted from the different balance sheets of «Oman Re»
Oman Reinsurance Company
(Oman Re)
| Head office | Coral Building, 6th floor– Al Khuwair, P.O. Box: 1968, 114, Muscat, Oman |
| Tel | +968 243 97 700-702 |
| Fax | +968 243 97 777 |
info [at] omanre [dot] com [dot] om, lamees [at] omanre [dot] com [dot] om | |
| Website |