Astrée Assurances
 The company was established on October 22, 1949 by the Banque de Tunisie, the French group Concorde, Generali and the Assurances Générales Incendie whose portfolio was taken over by the Assurances Générales de France (AGF).
Astrée has had, for a long time, renowned shareholders. Apart from the Banque de Tunisie, its board included Allianz, AXA, Generali and even Munich Re.
On the local market, Astrée embodies stability and balance. Successive leaders have always distanced themselves from all kinds of turnover and growth battles.
The sole creed considered is profitability. This line requires the building of a balanced portfolio comprising personal lines and industrial risks. Past and current results do summarize this philosophy which has elevated the company to the rank of the wise component of the market.
Astrée Assurances in 2011
| Share capital | 13 379 200 USD |
| Turnover | 67 716 405 USD |
| Total assets | 337 622 719 USD |
| Shareholder’s equity | 56 248 900 USD |
| Net technical result | 7 867 421 USD |
| Net profit | 8 842 406 USD |
| Non life loss ratio | 70.7% |
| Management expenses ratio | 13.4% |
| Non life combined ratio | 78% |
| Number of agencies | 54 |
| Number of employees | 158 |
Main shareholders
| Groupe Banque de Tunisie | 58.24% |
| Groupe des Assurances du Crédit Mutuel | 30.21% |
| Others | 11.55% |
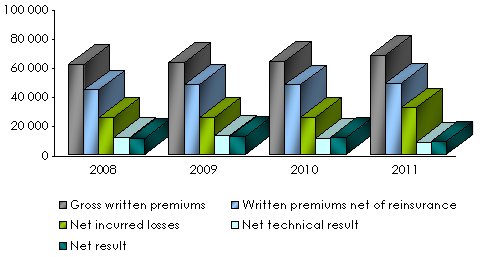
Main technical highlights: 2008 - 2011
en USD| 2008 | 2009 | 2010 | 2011 | |
|---|---|---|---|---|
Gross written premiums | 61 629 912 | 62 942 073 | 63 644 957 | 67 716 405 |
Written premiums net of reinsurance | 44 158 938 | 47 749 355 | 47 594 016 | 48 719 094 |
Net earned premiums | 33 738 454 | 36 788 680 | 34 345 941 | 35 527 830 |
Gross incurred losses | 26 510 649 | 42 029 132 | 30 986 929 | 41 192 242 |
Gross non life incurred losses | 23 726 906 | 38 918 429 | 29 441 407 | 37 735 995 |
Net incurred losses | 25 225 498 | 25 010 718 | 25 049 132 | 31 740 580 |
Gross management expenses | 6 357 770 | 7 008 668 | 7 171 387 | 7 120 038 |
Gross non life management expenses | 6 060 463 | 6 729 291 | 6 256 390 | 5 870 588 |
Loss ratio | 47.2% | 76% | - | 70.7% |
Expenses ratio | 11.5% | 11.6% | 19.5% | 13.4% |
Non life expenses ratio | 9.2% | 9.8% | 12.2% | 7.3% |
Combined ratio | 56.4% | 85.8% | - | 78% |
Net technical result | 11 233 585 | 12 846 372 | 10 866 852 | 7 867 421 |
Net result | 10 747 655 | 12 040 855 | 11 277 881 | 8 842 406 |
Breakdown of gross written premiums per class of business: 2008-2011
in USD| 2008 | 2009 | 2010 | 2011 | 2011 shares | |
|---|---|---|---|---|---|
| Non life | |||||
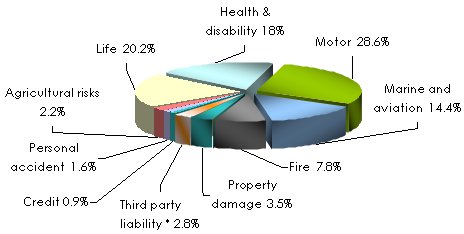
Health and disability | 10 508 029 | 9 862 528 | 10 392 686 | 12 199 576 | 18.0% |
Motor | 19 775 006 | 20 772 477 | 20 766 424 | 19 375 934 | 28.6% |
Marine and aviation | 9 160 121 | 7 706 899 | 8 254 957 | 9 747 975 | 14.4% |
Fire | 4 666 067 | 5 068 246 | 4 744 220 | 5 286 622 | 7.8% |
Property damage | 1 845 494 | 2 248 898 | 1 622 512 | 2 361 200 | 3.5% |
Third party liability* | 1 677 147 | 1 625 510 | 1 814 193 | 1 913 102 | 2.8% |
Credit | 597 346 | 522 561 | 553 108 | 565 988 | 0.9% |
Agricultural risks | 1 426 740 | 1 539 696 | 1 211 843 | 1 059 927 | 1.6% |
Personal accident | 2 013 516 | 1 882 162 | 1 695 167 | 1 503 375 | 2.2% |
Total non life | 51 669 466 | 51 228 977 | 51 055 110 | 54 013 699 | 79.8% |
| Life | |||||
Total life | 9 960 446 | 11 713 096 | 12 589 847 | 13 702 706 | 20.2% |
Grand total | 61 629 912 | 62 942 073 | 63 644 957 | 67 716 405 | 100% |
Breakdown of gross written premiums per class of business in 2011
 * Including decennial liability
 Net technical results: 2008-2011
in USD| 2008 | 2009 | 2010 | 2011 | 2011 shares | |
|---|---|---|---|---|---|
| Non life | |||||
Health and disability | 1 839 598 | 1 221 567 | 1 089 285 | 834 888 | 10.6% |
Motor | 4 457 448 | 6 308 812 | 6 152 428 | 2 513 294 | 32% |
Marine and aviation | 935 839 | 491 760 | 99 613 | 847 295 | 10.8% |
Fire | 951 435 | 1 240 756 | 283 562 | -665 887 | -8.5% |
Property damage | 32 400 | 420 544 | 388 374 | 32 360 | 0.4% |
Third party liability | 1 190 137 | 1 203 256 | 944 394 | 730 596 | 9.3% |
Credit* | - 5 706 | 132 330 | -35 482 | 168 710 | 2.2% |
Agricultural risks | -134 291 | - 3 400 | -174 794 | 97 809 | 1.2% |
Personal accident | 1 105 778 | 1 320 962 | 715 892 | 984 458 | 12.5% |
Total non life | 10 372 636 | 12 336 588 | 9 463 272 | 5 543 523 | 70.5% |
| Life | |||||
Total life | 860 948 | 509 784 | 1 403 580 | 2 323 898 | 29.5% |
Grand total | 11 233 585 | 12 846 372 | 10 866 852 | 7 867 421 | 100% |
Gross incurred losses: 2008-2011
in USD| 2008 | 2009 | 2010 | 2011 | 2011 shares | |
|---|---|---|---|---|---|
| Non life | |||||
Health and disability | 6 219 239 | 7 360 092 | 6 435 996 | 9 751 334 | 23.7% |
Motor | 14 872 419 | 11 448 804 | 13 614 865 | 17 410 807 | 42.3% |
Marine and aviation | 470 947 | 10 459 750 | 2 776 729 | 581 699 | 1.4% |
Fire | 668 636 | 2 301 765 | 4 880 924 | 8 506 117 | 20.6% |
Property damage | 290 866 | 308 813 | 328 215 | 580 939 | 1.4% |
Third party liability | 307 058 | 363 082 | 348 799 | 345 425 | 0.8% |
Credit | 226 971 | 201 748 | 133 226 | 145 863 | 0.4% |
Agricultural risks | 469 520 | 6 262 645 | 715 868 | 332 200 | 0.8% |
Personal accident | 201 250 | 211 730 | 206 785 | 81 611 | 0.2% |
Total non life | 23 726 906 | 38 918 429 | 29 441 407 | 37 735 995 | 91.6% |
| Life | |||||
Total life | 2 783 743 | 3 110 703 | 1 545 522 | 3 456 247 | 8.4% |
Grand total | 26 510 649 | 42 029 132 | 30 986 929 | 41 192 242 | 100.0% |
Exchange rate TND/USD as at 31/12 | 2008 | 2009 | 2010 | 2011 |
0.78412 | 0.76309 | 0.7009 | 0.66896 |

Contact
| Head office | 45, Avenue Kheireddine Pacha, P.O box 780, Tunis, Tunisia |
| Phone | (+216) 71 904 211 |
| Fax | (+216) 71 902 723 |
courrier [at] astree [dot] com [dot] tn | |
| Website |
