Abu Dhabi National Insurance (ADNIC)
 40 years on, ADNIC is still standing among the best insurers of the Arab world, getting hold of leading positions in the different rankings created by Al Bayan magazine.
Out of the 300 Arab companies covered in 2011 by the Lebanese magazine, ADNIC has ranked 6th in terms of shareholder’s equity, 9th in terms of the premiums written and came 11th in the ranking established according to the profits generated.
Unlike the other regional companies, the 2008 financial crisis did not seem to have affected ADNIC which continues to exhibit excellent results. The only catch to this rosy picture: the figures of 2012 reported a decrease in the company’s margins accounted for partly by the fierce competition involving the Emirati insurers.
 |  |
| Khalifa Mohamed Al-Kindi | Walid A. Sidani |
| Chairman of the board | Chief executive officer |
ADNIC in 2012
| Share capital | 102 093 750 USD |
| Turnover | 625 954 000 USD |
| Total assets | 1 124 172 794 USD |
| Shareholders’ equity | 568 886 521 USD |
| Net technical result | 76 011 000 USD |
| Net profit | 39 405 465 USD |
| Net loss ratio | 77.10% |
| Expenses ratio | 14.49% |
| Combined ratio | 91.59% |
| Number of branches and offices in UAE | 17 |
| Number of employees | 479 |
| Rating | A- (strong) by Standard & Poor’s A (excellent) by A.M. Best |
ADNIC: management
| Chairman of the board | Khalifa Mohamed Al-Kindi |
| Vice-chairman of the board | Sheikh Mohammed Bin Saif Al-Nehayan |
| Walid A. Sidani | Chief executive officer |
ADNIC: main shareholders
| Abu Dhabi Investment Council | 23.80% |
| Khalaf A. Al Otaiba | 10.11% |
| Sh. Tahnoon M. Al Nahayyan | 5.30% |
| Al Dhabi Investments Co. | 5.12% |
| Others | 55.67% |
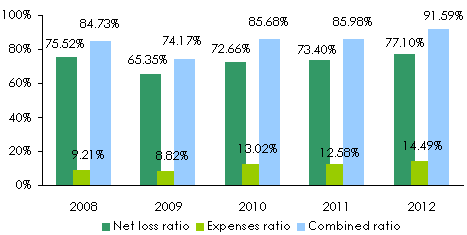
ADNIC: main technical highlights: 2008-2012
In thousands USD| 2008 | 2009 | 2010 | 2011 | 2012 | |
|---|---|---|---|---|---|
Gross written premiums | 369 238 | 422 500 | 482 042 | 562 529 | 625 954 |
Written premiums net of reinsurance | 129 600 | 166 516 | 198 132 | 308 446 | 357 502 |
Net earned premiums | 114 958 | 148 539 | 185 886 | 256 970 | 330 521 |
Net incurred losses | 86 822 | 97 063 | 135 057 | 188 620 | 254 821 |
Management expenses 1 | 34 006 | 37 273 | 62 744 | 70 774 | 90 720 |
Net loss ratio | 75.52% | 65.35% | 72.66% | 73.40% | 77.10% |
Expenses ratio 2 | 9.21% | 8.82% | 13.02% | 12.58% | 14.49% |
Combined ratio | 84.73% | 74.17% | 85.68% | 85.98% | 91.59% |
Financial income | 28 531 | 59 956 | 18 144 | 15 675 | 22 067 |
Net technical result | 49 029 | 63 739 | 60 381 | 74 826 | 76 011 |
Net result | 57 218 | 14 146 | 38 777 | 43 066 | 39 405 |

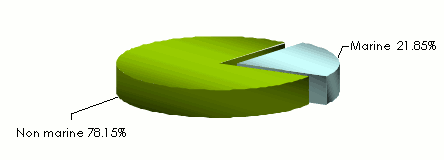
ADNIC: breakdown of gross written premiums per class of business: 2008-2012
In thousands USD| 2008 | 2009 | 2010 | 2011 | 2012 | 2011/2012 evolution | 2012 shares | |
|---|---|---|---|---|---|---|---|
Marine | 93 131 | 109 711 | 123 853 | 123 919 | 136 797 | 10.39% | 21.85% |
Non marine | 276 107 | 312 789 | 358 189 | 438 610 | 489 157 | 11.52% | 78.15% |
Total | 369 238 | 422 500 | 482 042 | 562 529 | 625 954 | 11.28% | 100% |
Breakdown of gross written premiums per class of business in 2012
ADNIC: breakdown of net earned premiums per class of business: 2008-2012
in thousands USD| 2008 | 2009 | 2010 | 2011 | 2012 | 2011/2012 evolution | 2012 shares | |
|---|---|---|---|---|---|---|---|
Marine | 5 035 | 5 299 | 10 600 | 15 054 | 23 775 | 57.93% | 7.19% |
Non marine | 109 923 | 143 240 | 175 286 | 241 916 | 306 746 | 26.80% | 92.81% |
Total | 114 958 | 148 539 | 185 886 | 256 970 | 330 521 | 28.62% | 100% |
ADNIC: net technical results: 2008-2012
in thousands USD| 2008 | 2009 | 2010 | 2011 | 2012 | 2011/2012 evolution | 2012 shares | |
|---|---|---|---|---|---|---|---|
Marine | 8 304 | 7 503 | 10 834 | 18 451 | 20 381 | 10.46% | 26.81% |
Non marine | 40 725 | 56 236 | 49 547 | 56 375 | 55 630 | -1.32% | 73.19% |
Total | 49 029 | 63 739 | 60 381 | 74 826 | 76 011 | 1.58% | 100% |
ADNIC: net incurred losses: 2008-2012
in thousands USD| 2008 | 2009 | 2010 | 2011 | 2012 | 2011/2012 evolution | 2012 shares | |
|---|---|---|---|---|---|---|---|
Marine | 3 153 | 2 779 | 5 009 | 2 082 | 9 886 | 374.84% | 3.88% |
Non marine | 83 669 | 94 284 | 130 048 | 186 538 | 244 935 | 31.31% | 96.12% |
Total | 86 822 | 97 063 | 135 057 | 188 620 | 254 821 | 35.10% | 100% |
Technical ratios: 2008-2012
Exchange rate AED/USD as at 31/12 | 2008 | 2009 | 2010 | 2011 | 2012 |
0.27212 | 0.27231 | 0.27231 | 0.2723 | 0.27225 |

ADNIC: contact
| Head office | ADNIC Building, Sh. Khalifa street, P.O. Box 839, Abu Dhabi, United Arab Emirates |
| Phone | (971) 2 4080100 |
| Fax | (971) 2 4080604 |
adnic [at] adnic [dot] ae | |
| Website |
